Before you start
- Sub-agents is on. It is on by default. An admin can check it in Settings → AI Settings → Sub-agents, with the posture set to proactive.
- The Checkout Ops demo is installed. It is one of the demo data sources offered when a workspace is set up. It holds daily orders, sessions, deploys, payment-provider status, price changes and campaigns for August and September 2026.
- Optionally, Sub-agents may create queries is on, so the sub-agents’ evidence appears as queries in the report. Off, they work from inspections and the result is the same.
What is planted
From 2026-09-14, checkout-service release 5.2.0 breaks payments for iOS customers paying through PayFlow: their failure rate jumps from a few percent to well over half, and paid orders per day fall by about fifteen percent. Nothing else changes for Android, web or the other providers. Four decoys sit in the same window: a premium price increase on 2026-09-10, an APAC campaign that lifts sessions but not paid orders, a one-day PayFlow incident flag in us-east on 2026-09-15, and ordinary weekly seasonality. A good answer names the release and rules the decoys out with numbers.Step 1: Ask why
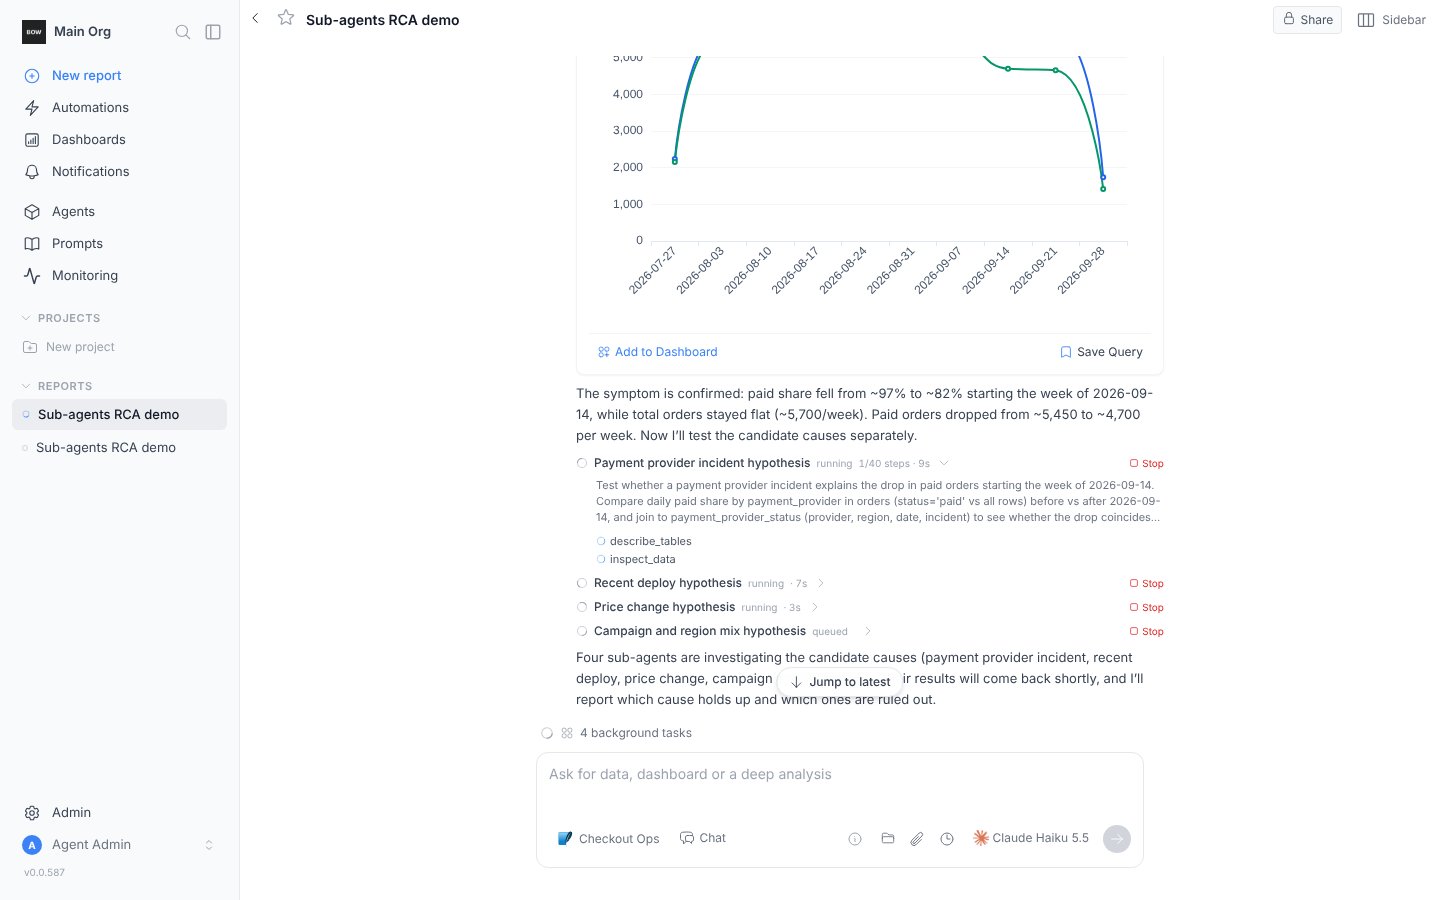
Open a report on Checkout Ops and ask:Paid orders dropped about 15% since mid-September. Why? Test the likely causes separately and tell me which one it is, with evidence, and which ones you ruled out.The agent first confirms the symptom with one query, then lists the candidate causes and launches a sub-agent for each: payment-provider incident, recent deploy, price change, traffic and campaign mix. Its message ends with one line saying what it launched; the cards below it are the sub-agents.
Step 2: Watch, or keep going
The status row shows 4 background tasks; hover it to see each sub-agent’s duration and steps, or open a card to follow its tool calls. You do not have to wait. Ask how is the investigation going? and the agent answers from the sub-agents’ progress so far.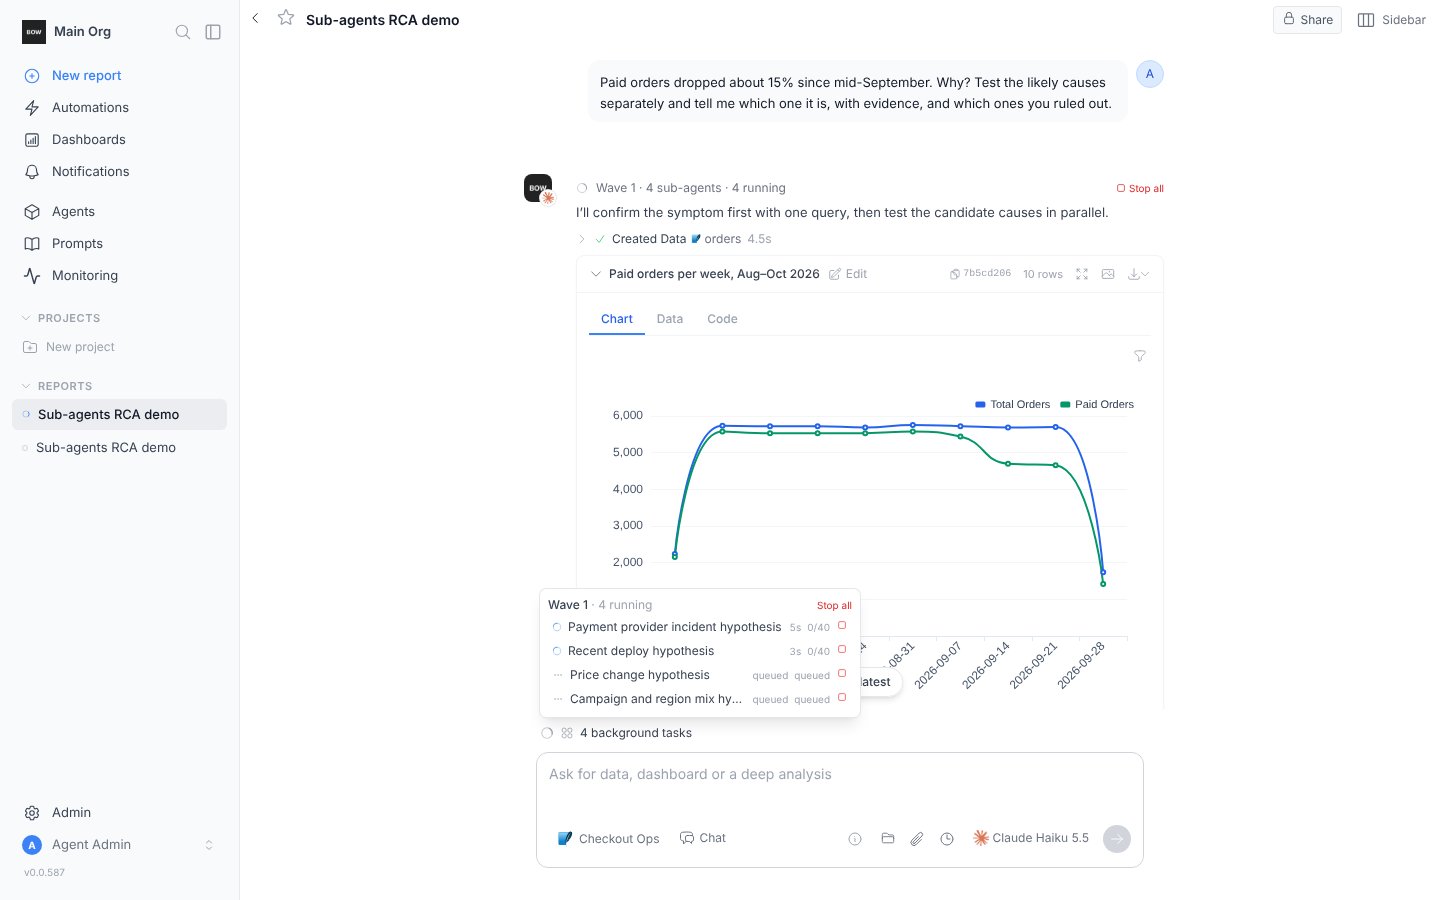
Step 3: Read the answer
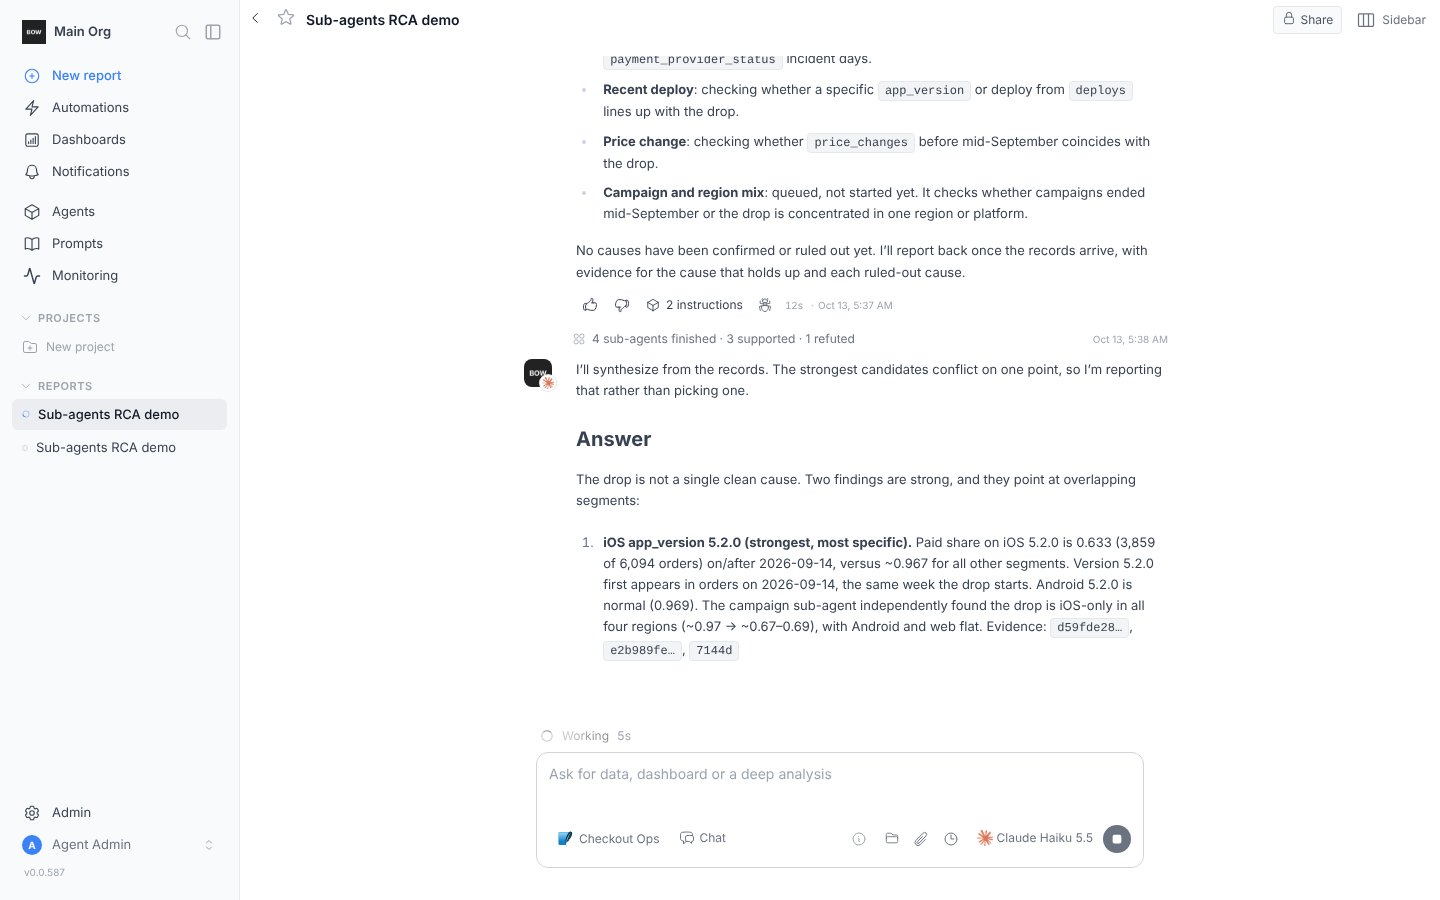
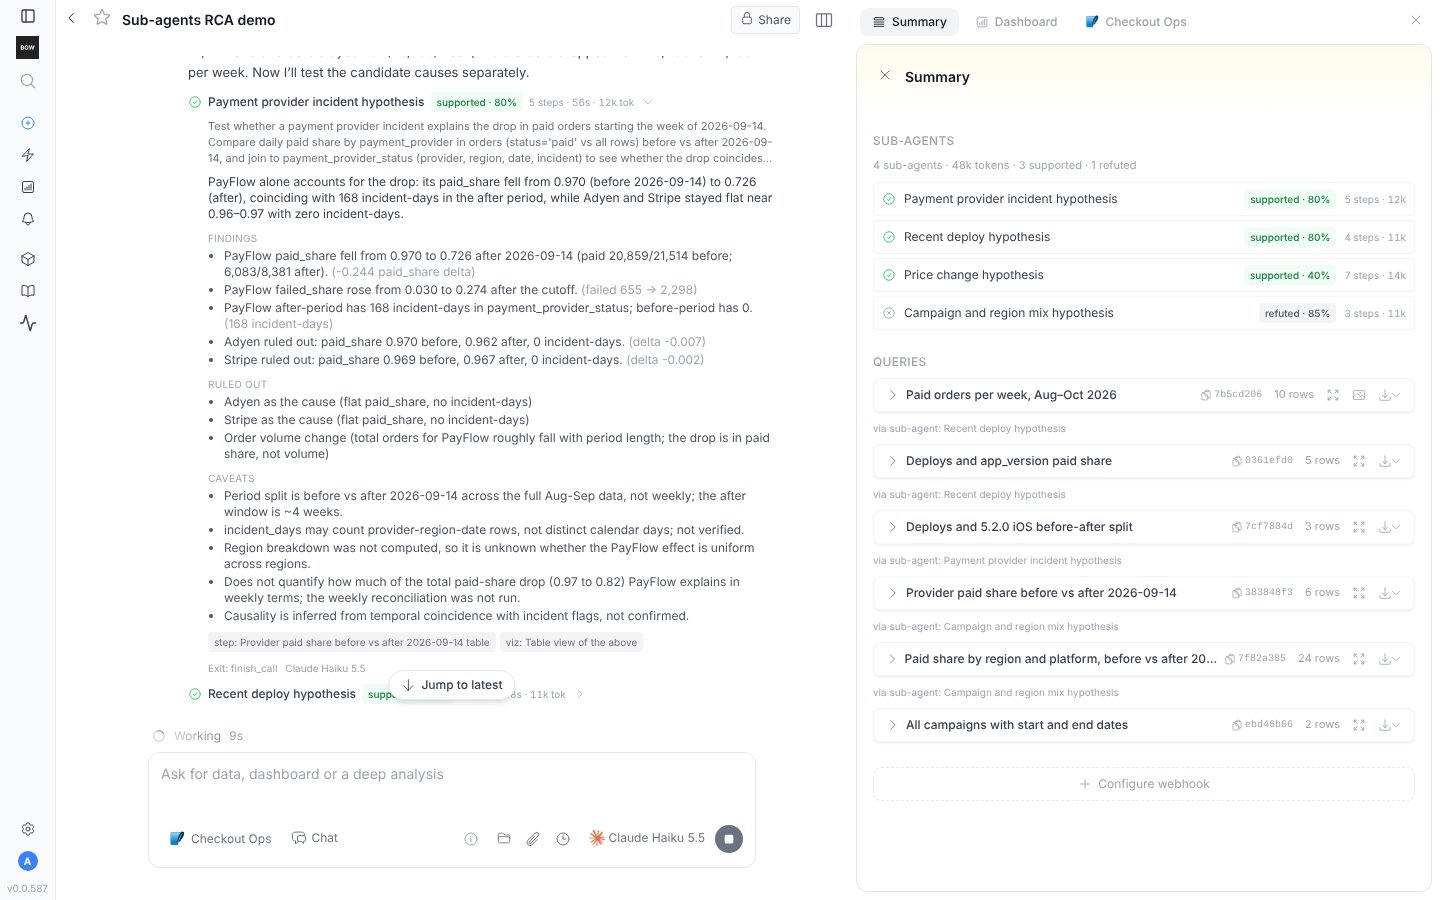
When the last sub-agent reports, a line records the wave and the agent writes the synthesis. On the planted data it names the iOS 5.2.0 release on PayFlow from 2026-09-14, gives the failure rate and the paid-share drop that support it, and rules out the other causes with the numbers each sub-agent found: the provider flag covers one day in one region, the price change predates the drop and hits every platform, the campaign moved sessions and not paid orders.