
Before you start
- Training Mode is on. An admin can check this in Settings → AI Settings → Agent capabilities → Training Mode.
- You can see the history. Org admins see runs for every agent. If you manage an agent, you see runs for the agents you manage only. Other users can’t query run history.
- There is some history to look at. Runs, feedback and tool calls are recorded as people use your agents. Thumbs-down ratings with a comment make the feedback questions below much more useful.
Step 1: Start a training session
Open Agents, select the agent, click ⋯ at the top right, and choose Start a training session. You can also switch the prompt box on the home page to Training. The session opens with three starters: Find Instructions Conflicts, Show Low Confidence Responses and Show Negative Feedback Responses. Click one, or type your own question.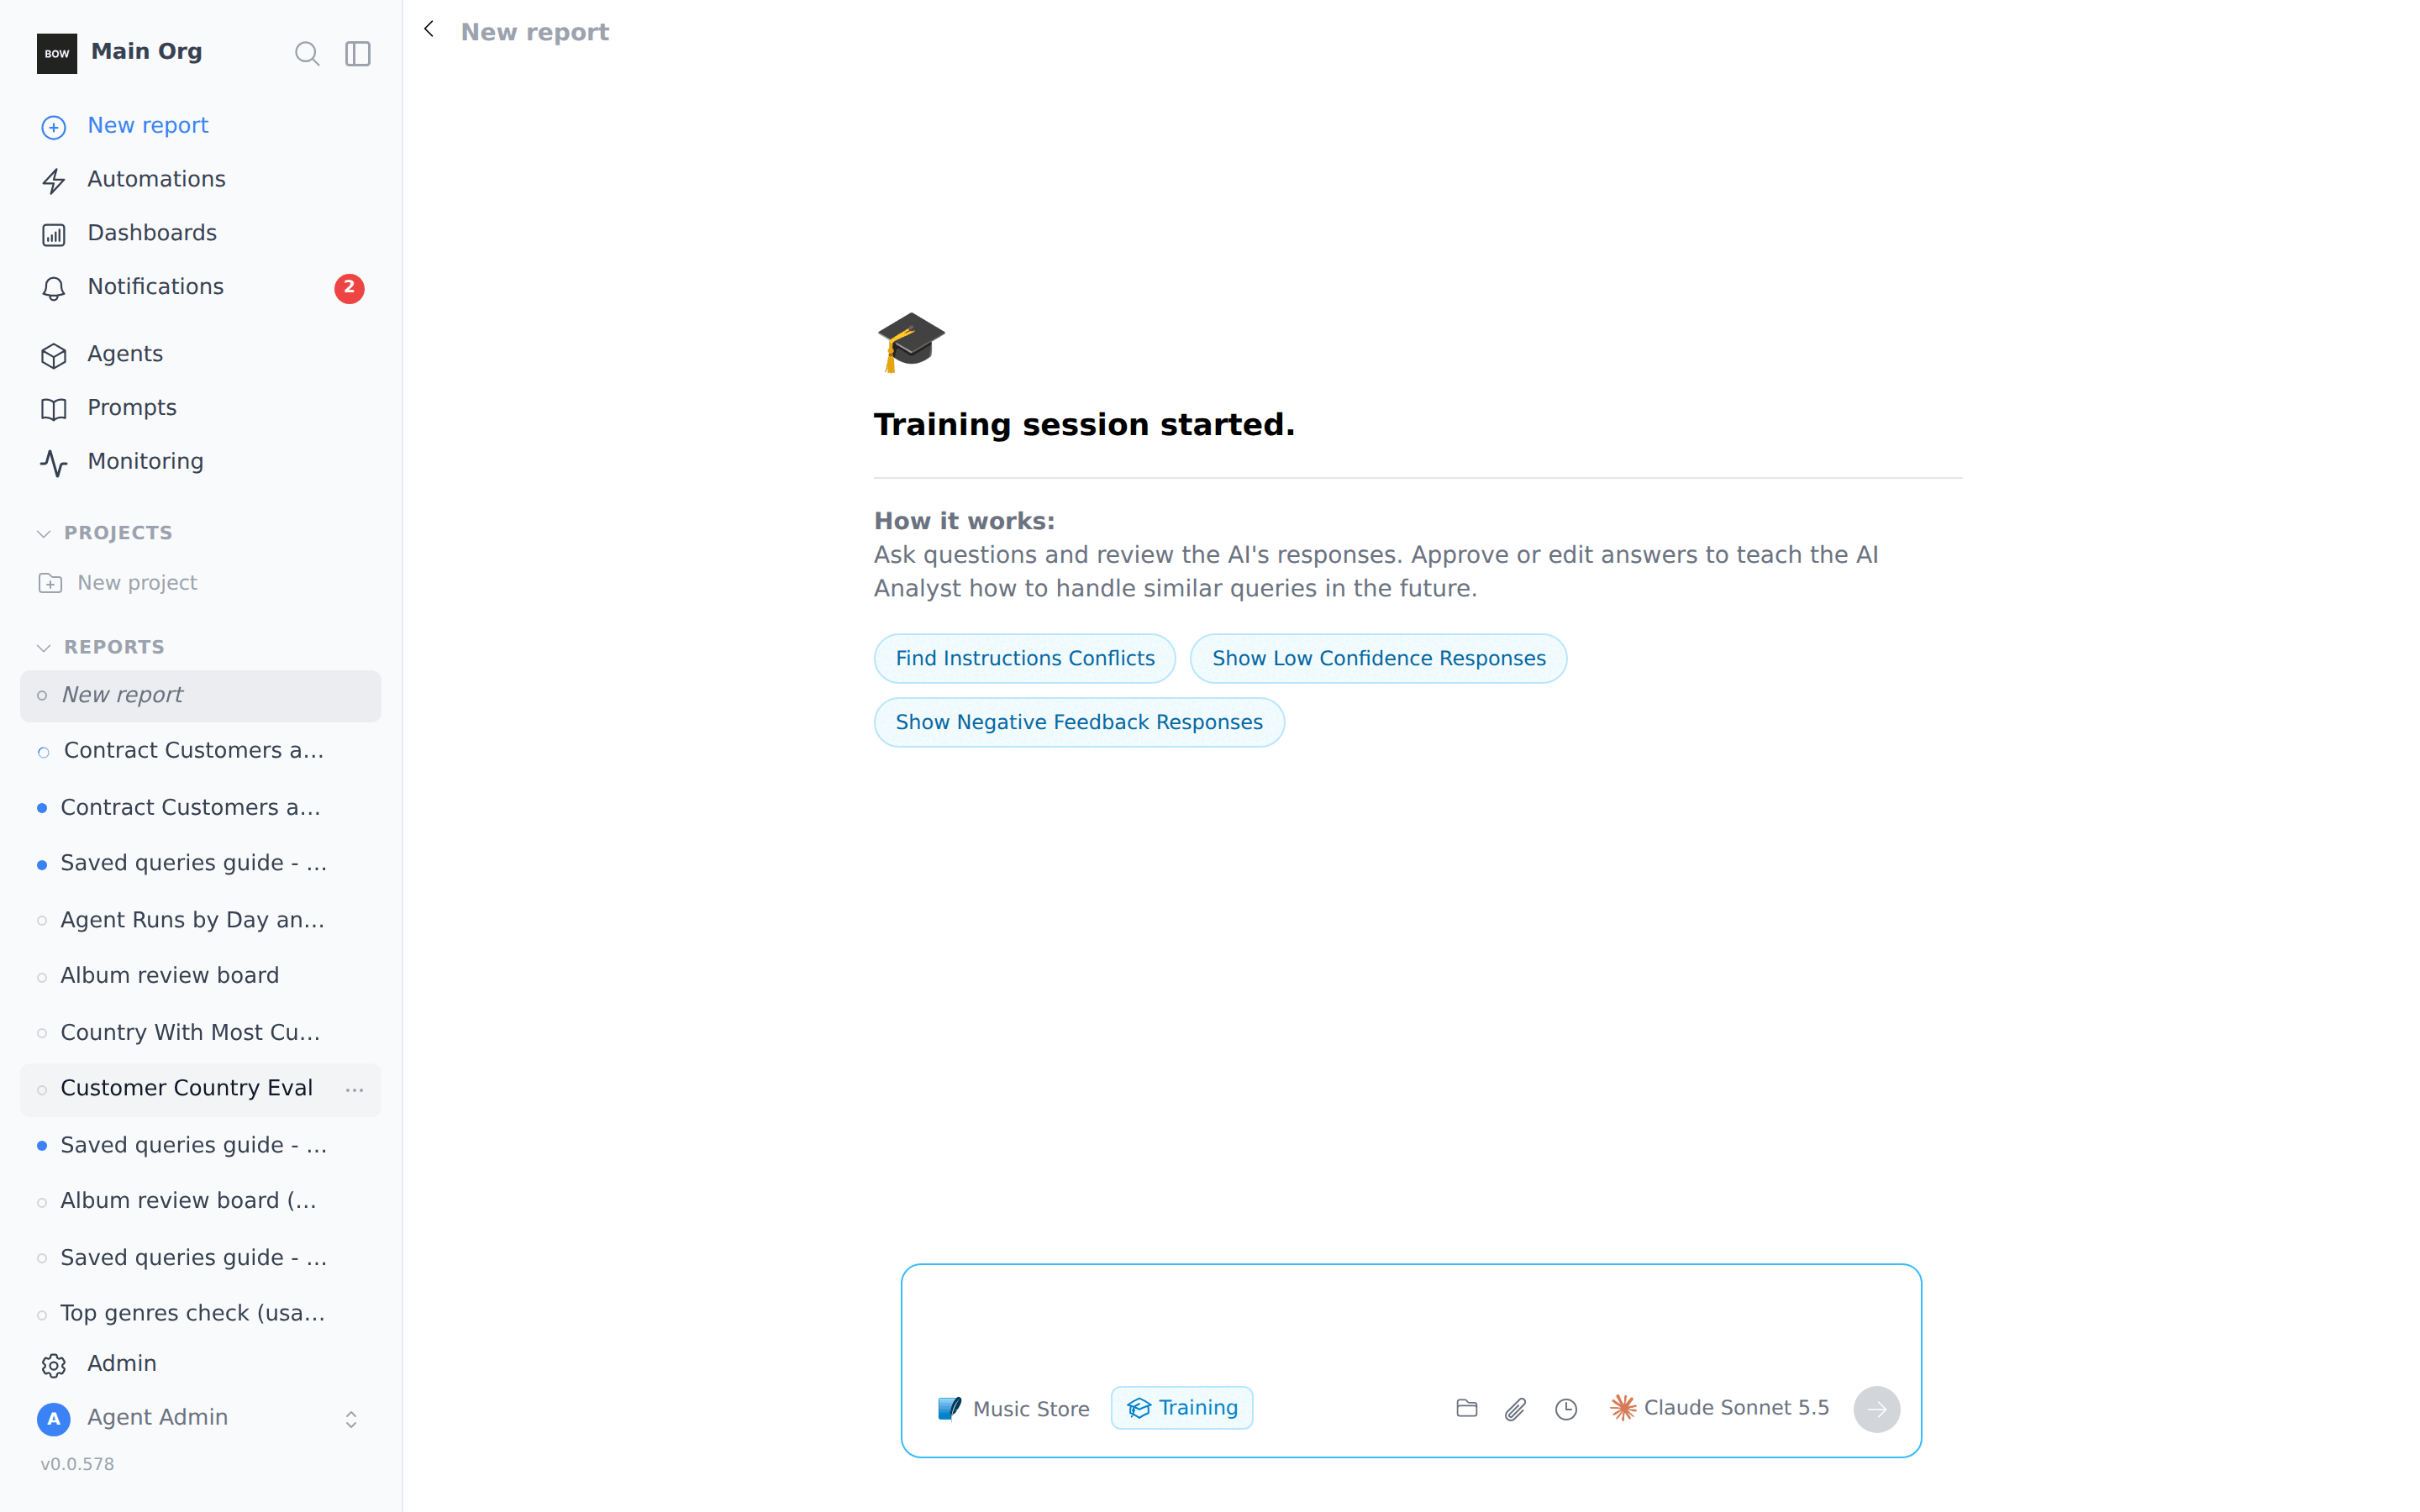
Step 2: Ask how your agents are used
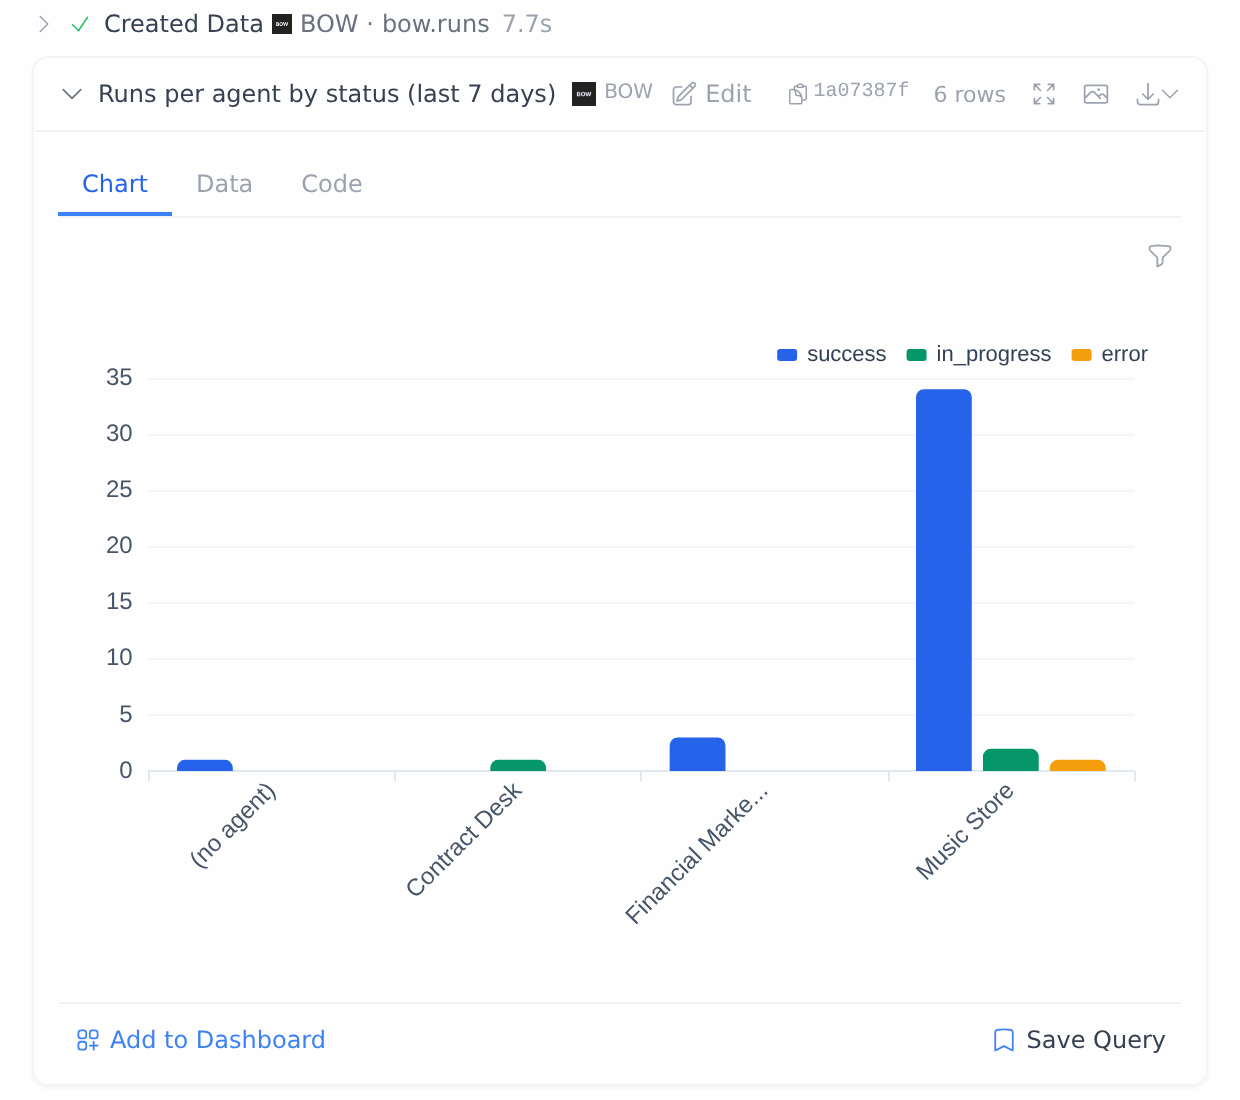
How many runs did each agent have in the last 7 days, by day and status? Show a chart.The agent queries a built-in, read-only source called BOW. Its step reads Created Data · BOW · bow.runs, and the result card is tagged BOW. Open the Data tab to see the rows and Code to see the exact query. If the first chart isn’t the view you want, ask for a different one:
Make that a bar chart with one group per agent, colored by status.The agent states the time window in its answer. When there is less history than the window you asked for, it says so (for example, “the data only goes back to 2026-10-05”).
Step 3: Find failing tools
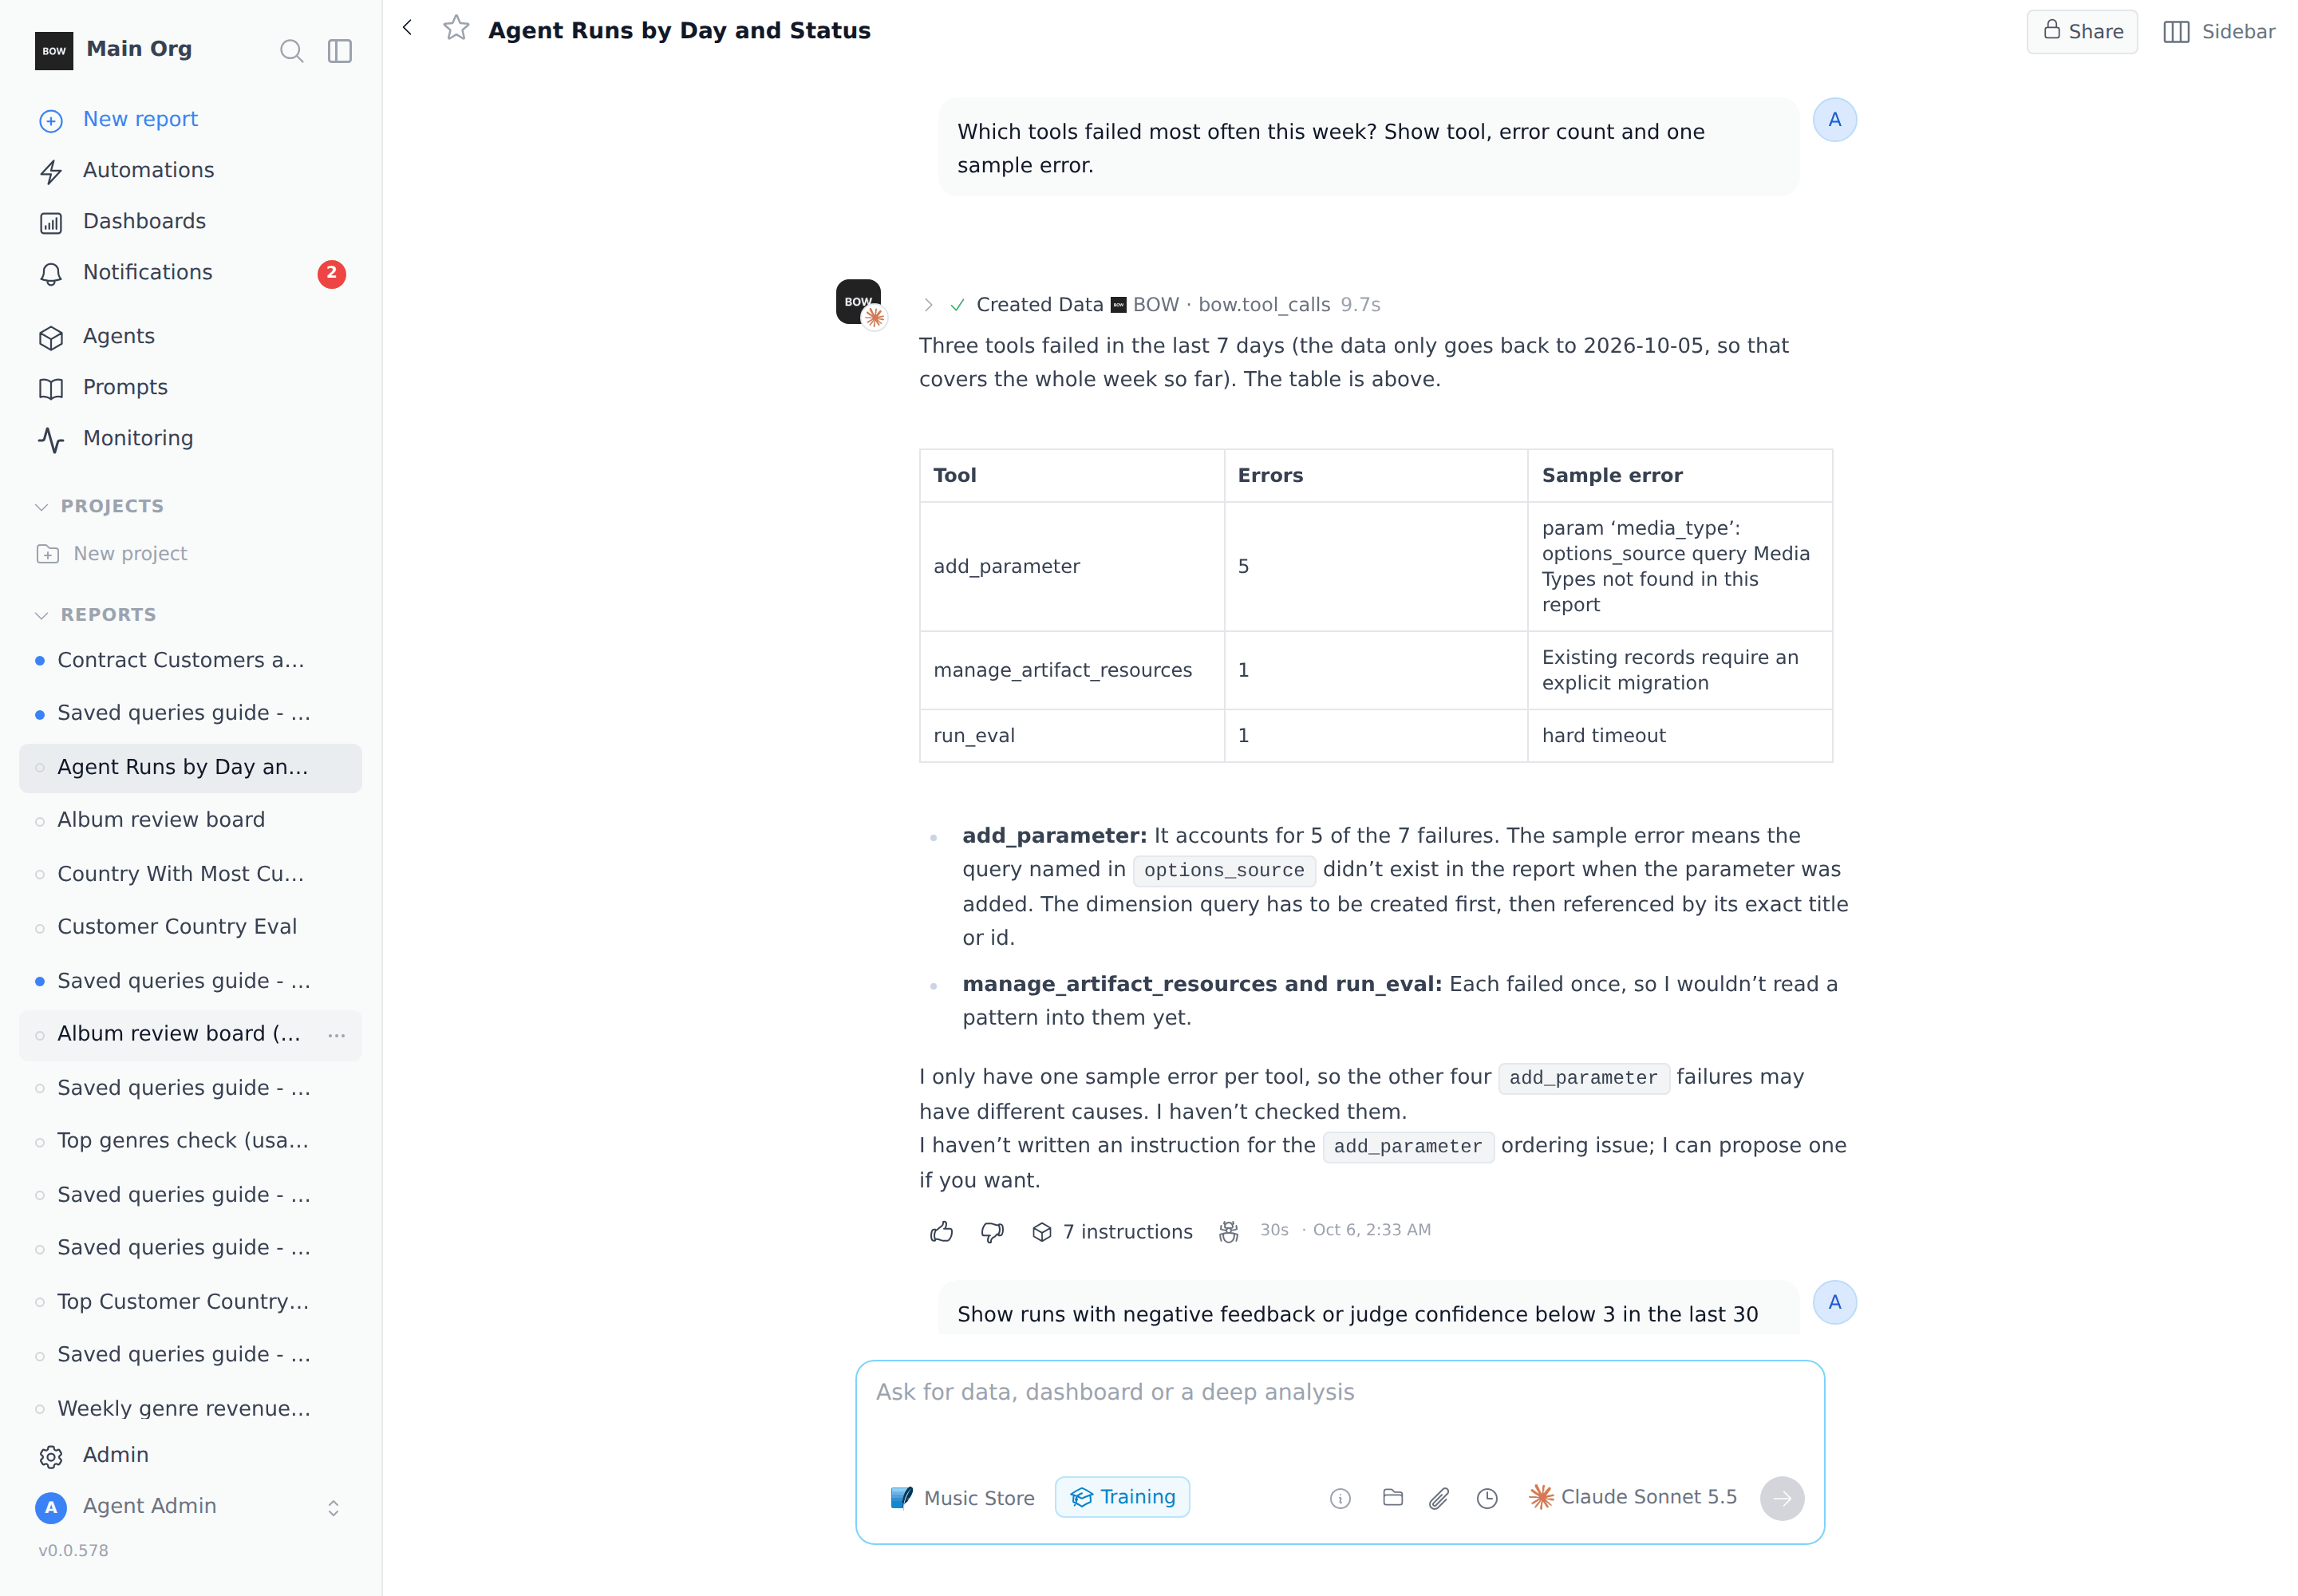
Which tools failed most often this week? Show tool, error count and one sample error.Tool-level questions use the second table, bow.tool_calls (one row per tool call). The agent counts errors per tool and quotes a real error message for each.
Step 4: Read negative feedback and low-confidence answers
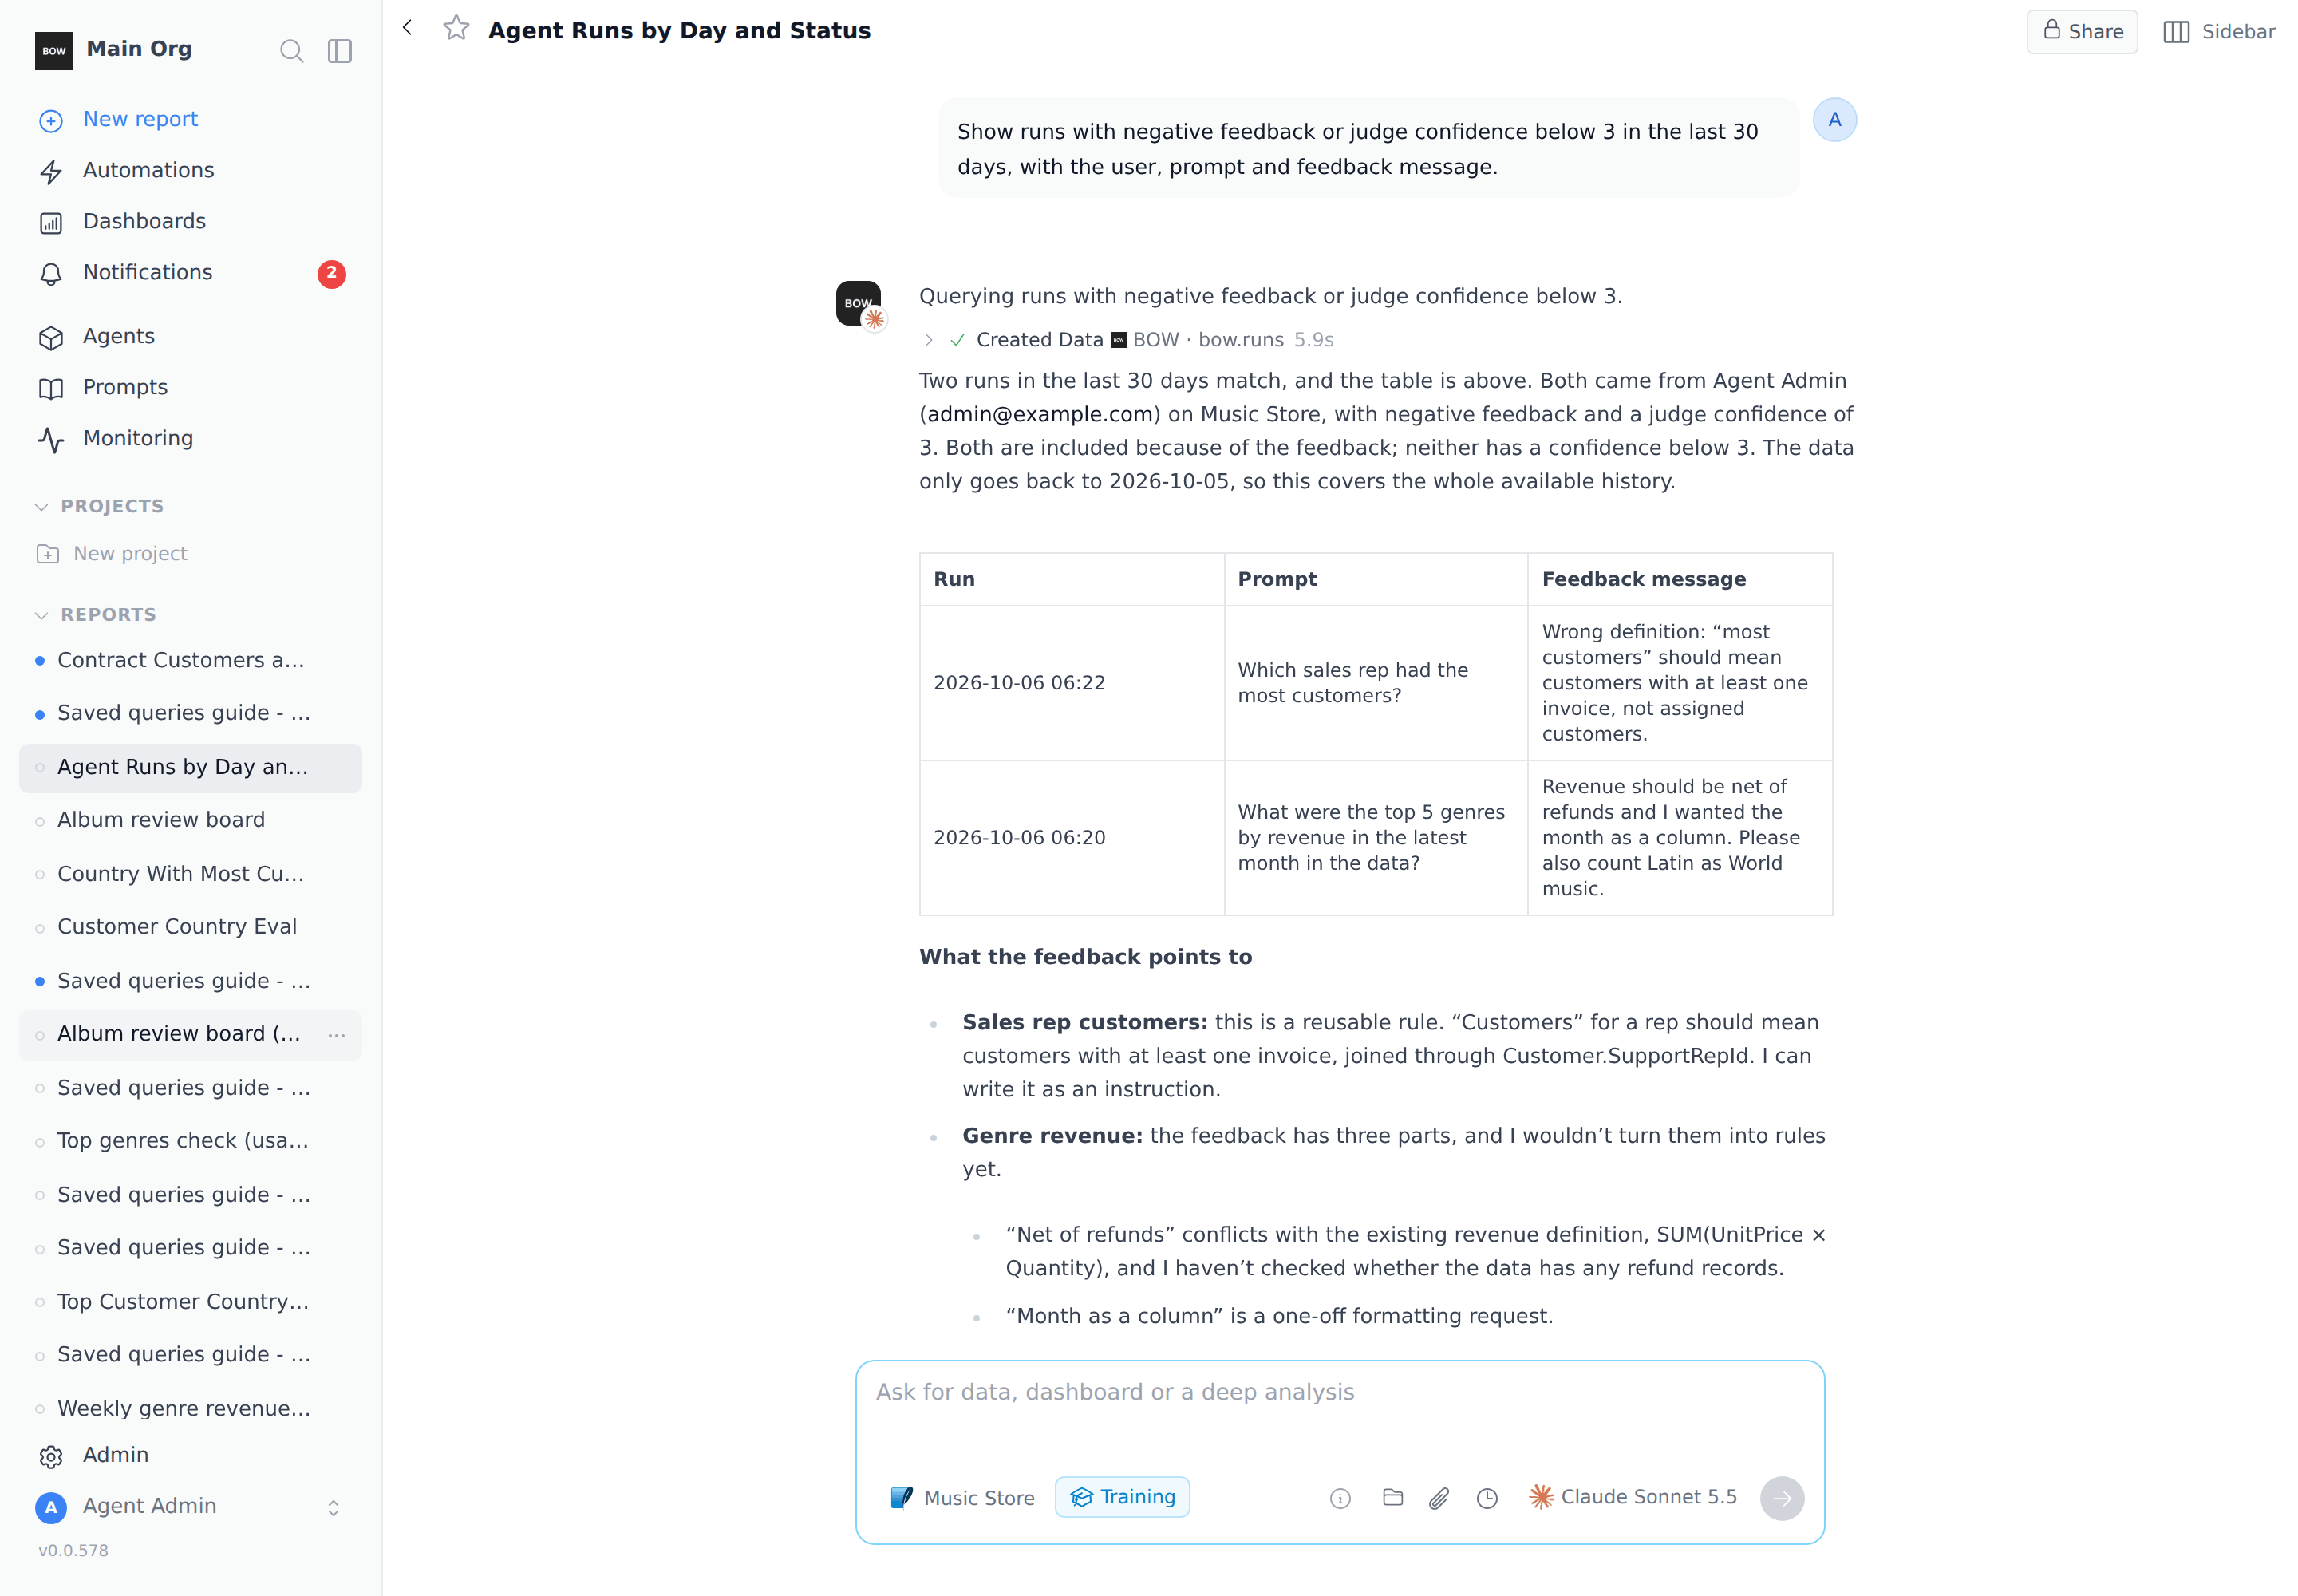
Show runs with negative feedback or judge confidence below 3 in the last 30 days, with the user, prompt and feedback message.You get the run time, user, prompt and the comment the user left with their thumbs-down. The agent also explains which runs matched and why. Judge confidence is a 1–5 score the quality judge gives each answer.
Step 5: Chart cost and tokens
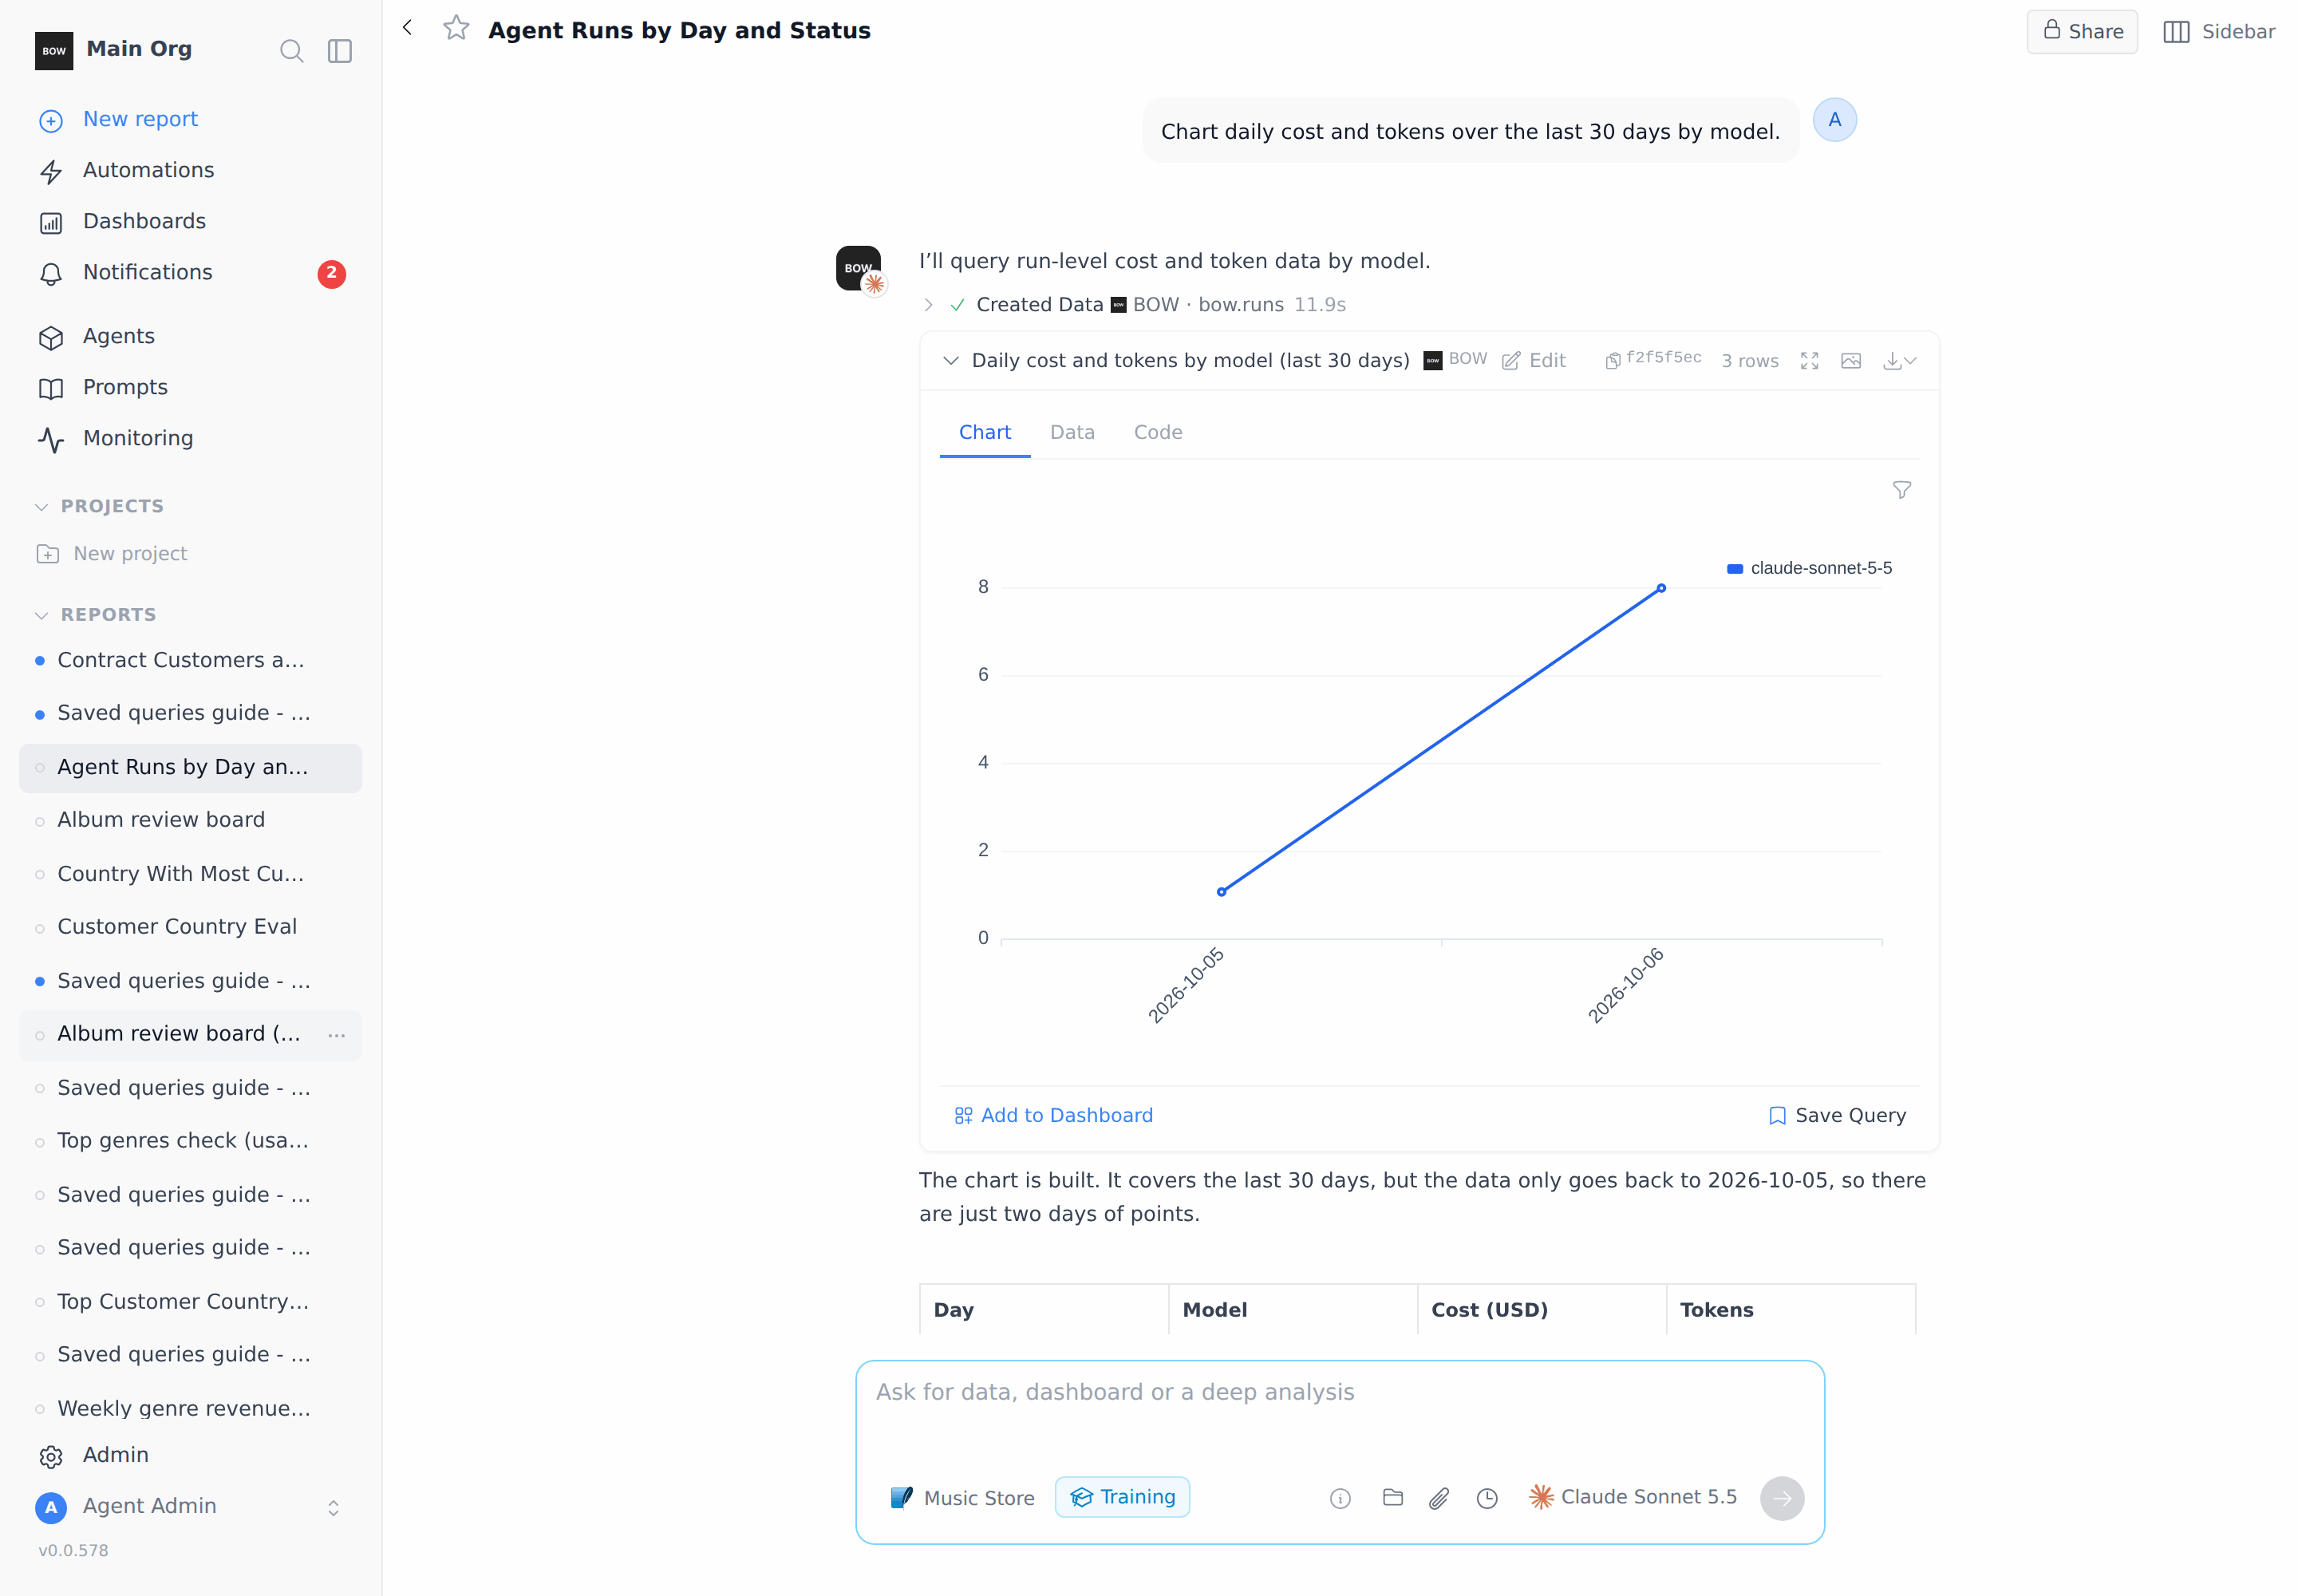
Chart daily cost and tokens over the last 30 days by model.The agent sums
cost_usd and tokens per day and model and charts them. Runs with no recorded model or cost show up as blank or none: unknown cost is not counted as zero.
Step 6: Review usage and get instruction fixes
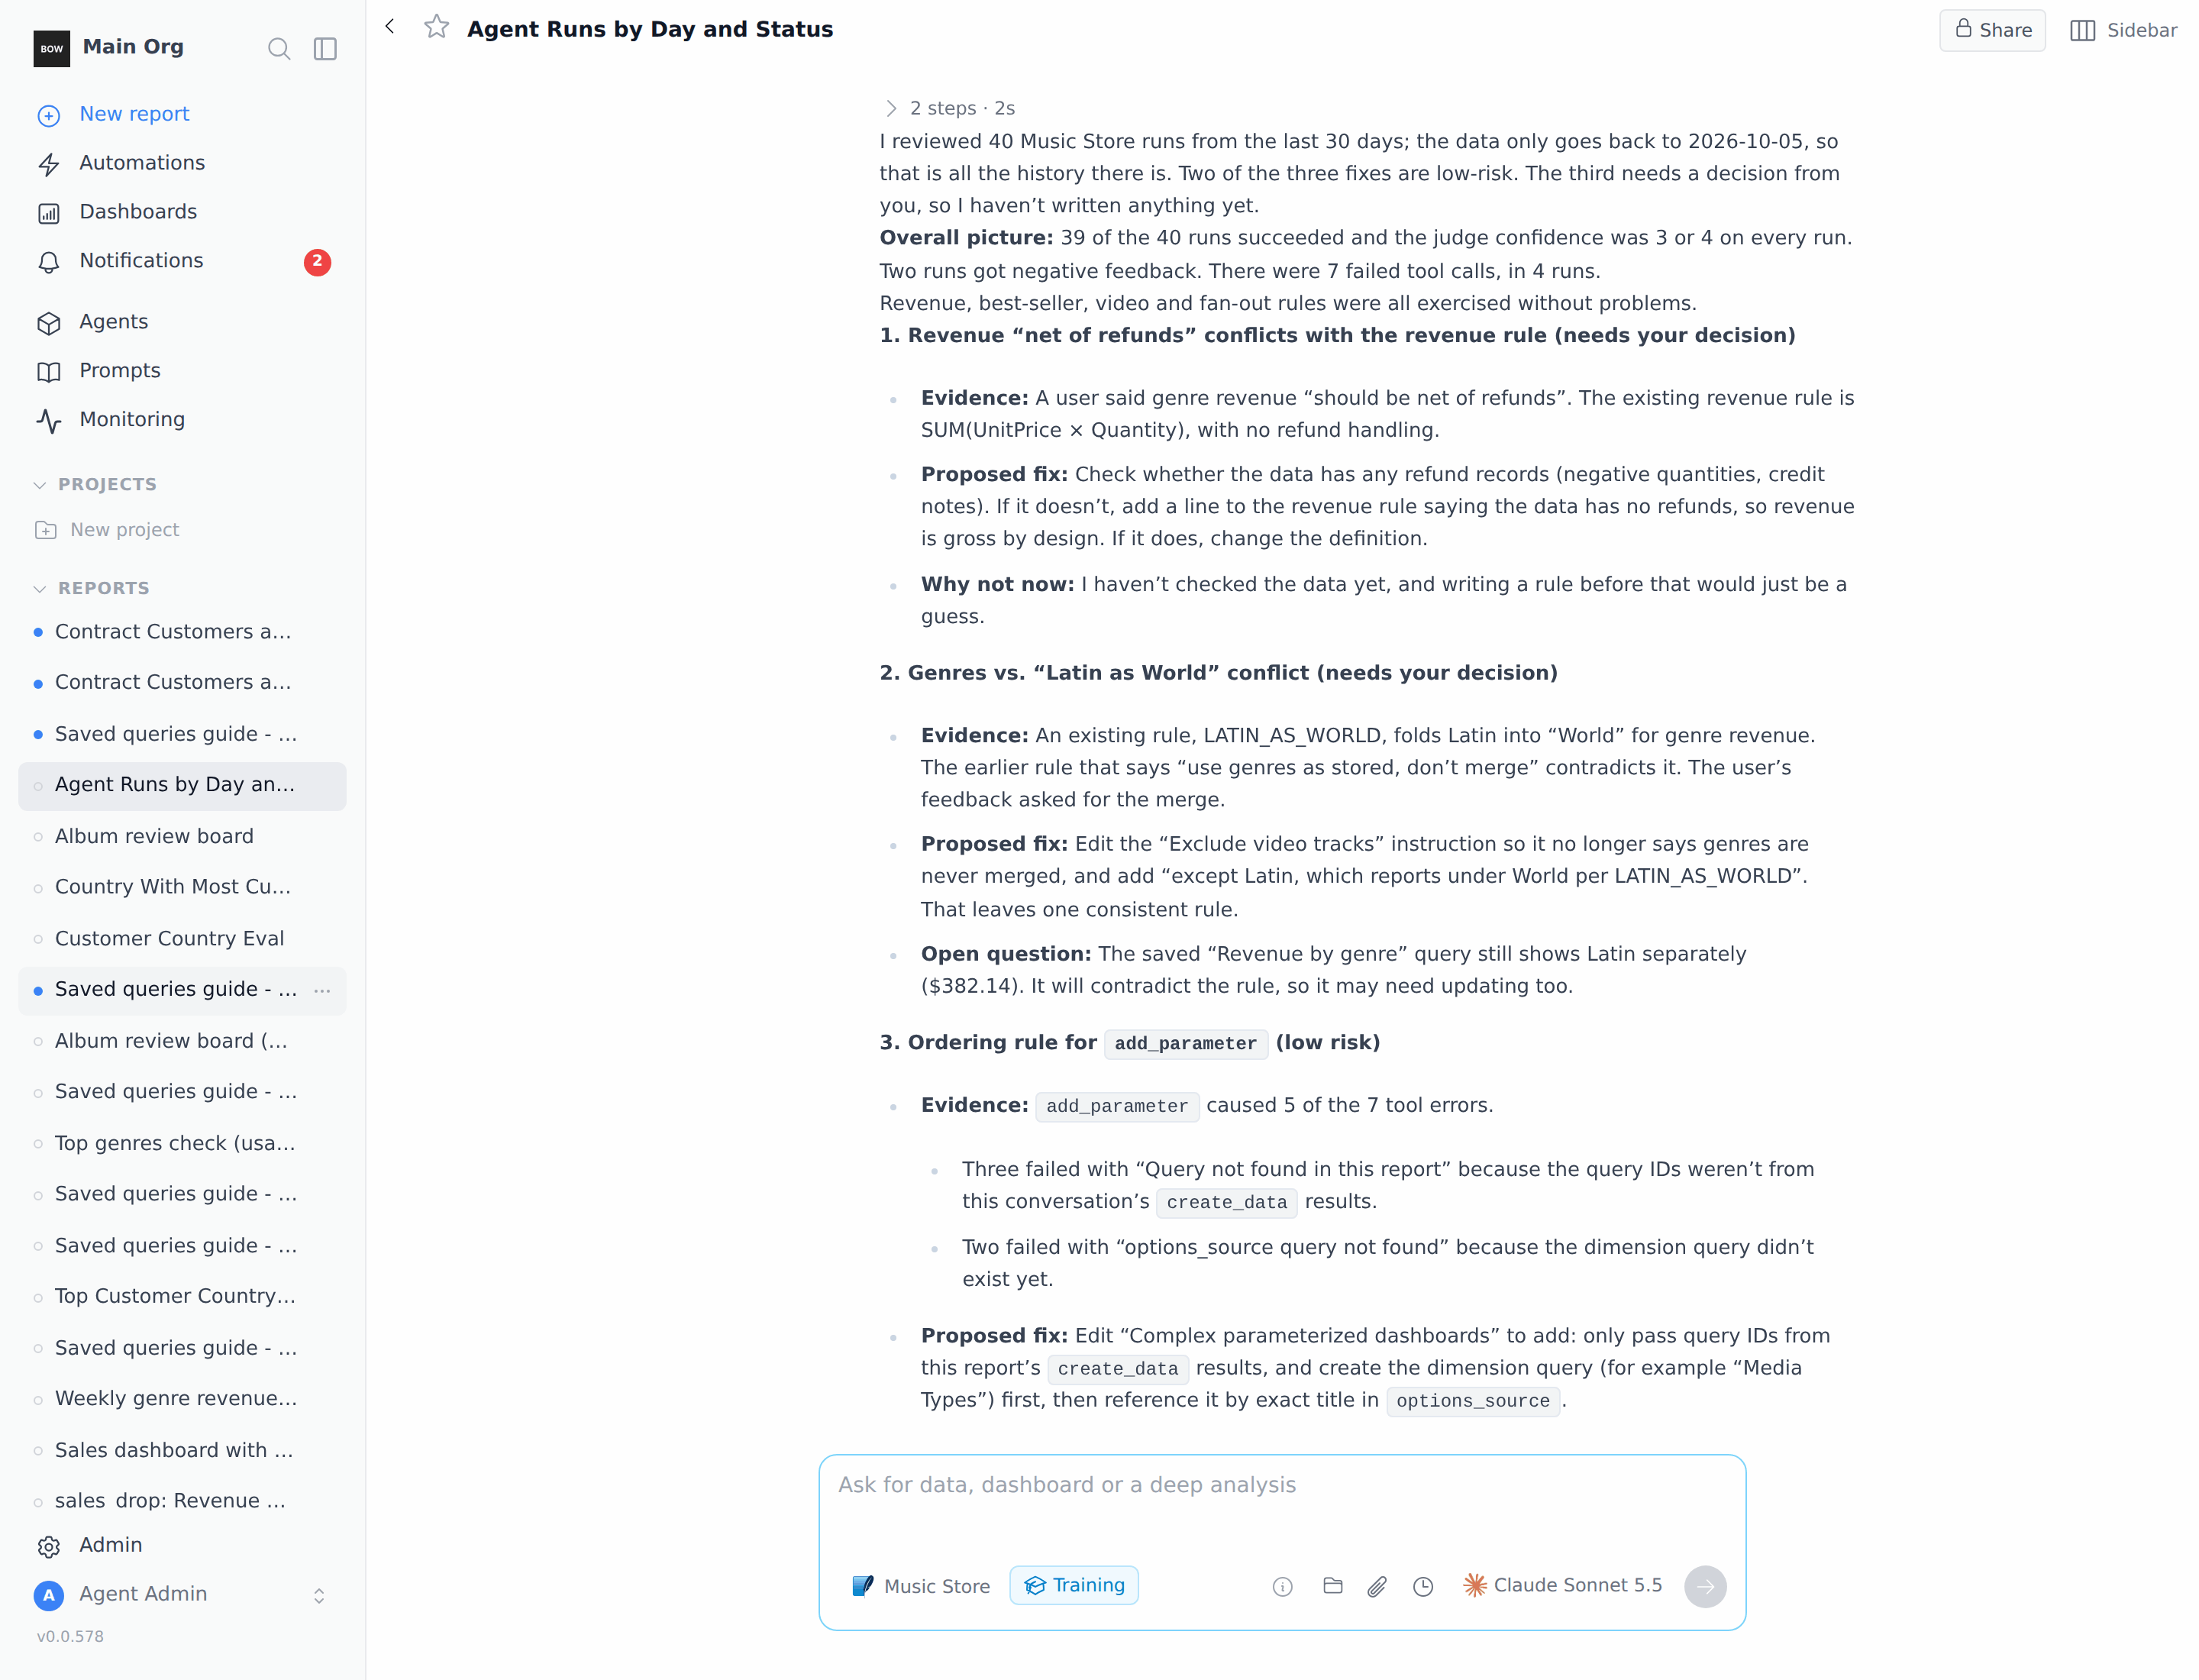
Review recent usage of the Music Store agent and propose the top 3 instruction fixes.Training sessions include a built-in skill, Review recent agent usage. The agent pulls the agent’s runs and tool errors, checks the existing instructions for coverage, and returns a ranked list: the evidence, the proposed fix, and whether it needs your decision. It tells you what is already covered.
What you can ask about
Each run is one row in bow.runs. Each tool call is one row in bow.tool_calls. You don’t need the field names; they help you be precise.More prompts to try
Things to know
- Time window. Questions cover the last 30 days unless you say otherwise. The longest window is 366 days; if you ask for “all history”, the agent uses 366 days and says so.
- Size limits. A query returns at most 10,000 rows or 1,000 groups. For bigger questions, the agent aggregates or narrows the window.
- What’s left out. Runs from evals are hidden unless you ask about evals. The current training session is never included in its own results.
- Unknown cost. Some runs have no recorded cost. The agent leaves them blank instead of counting them as zero.
- Who sees what. Access is checked on every query. Org admins see all agents; agent managers see only the agents they manage.
- Sharing. A report that holds run-history data can’t be shared publicly or published. Share it with people in your organization instead.
Monitoring or chat?
The Monitoring page shows the same history without a conversation. Explore gives the overview, Cost breaks down spend, and Diagnosis lists runs with Quick filters such as Errors, Failed queries, Negative feedback, Low confidence, Slow and Expensive.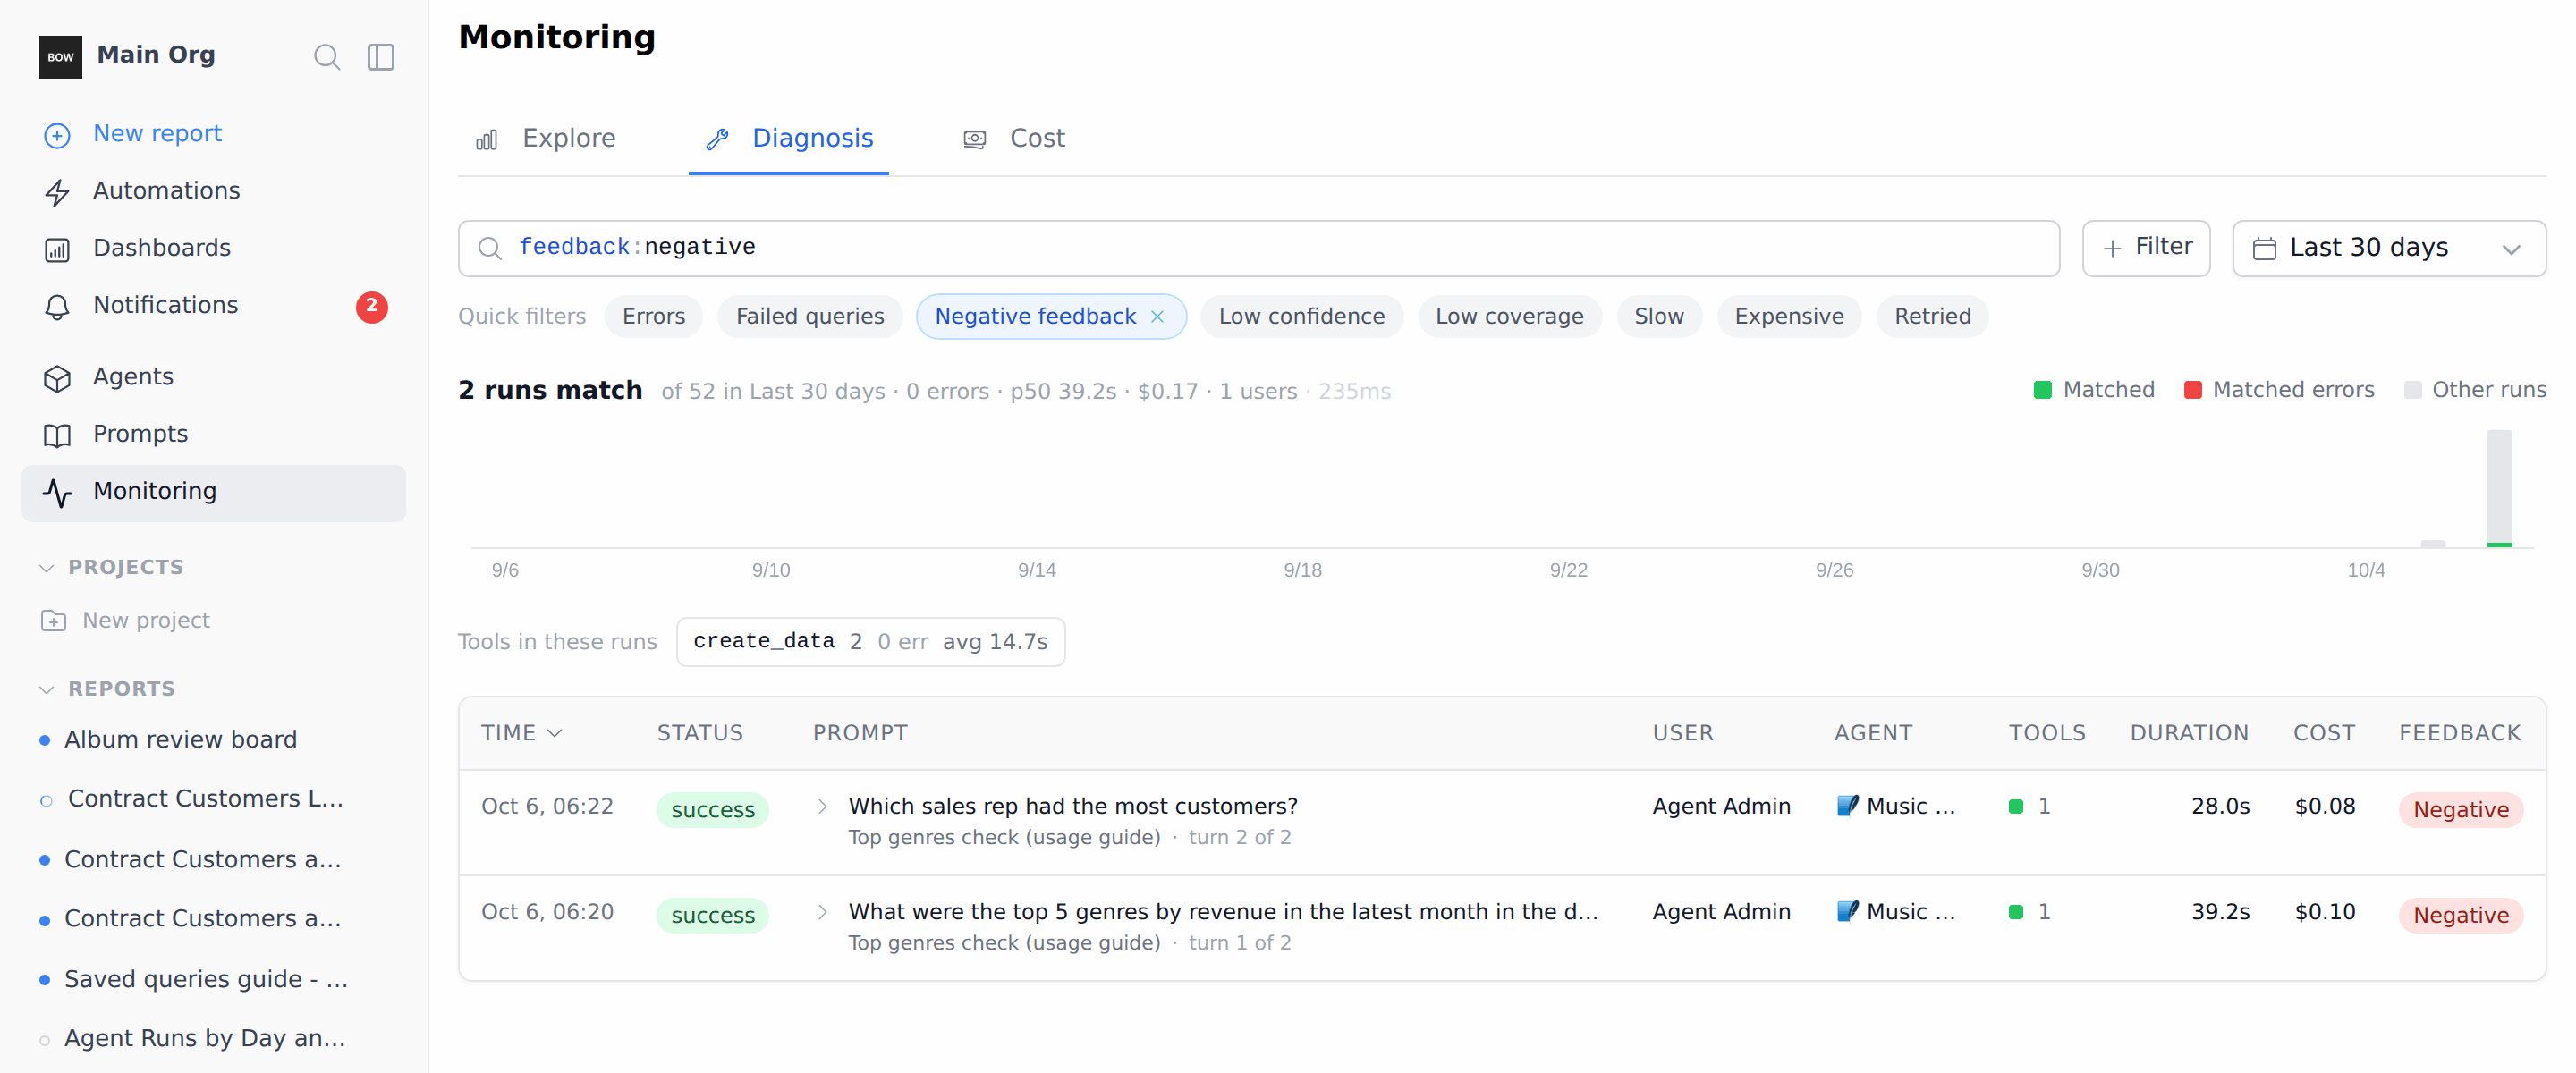
Tips
- Name the window. “Last 7 days” or “since September 1” gives a precise answer. The agent always states the window it used.
- Name the agent. “for the Music Store agent” keeps a review focused on one agent.
- Ask for the evidence. “show one sample error” or “include the feedback message” turns a count into something you can act on.
- Save what you reuse. Click Save Query on a result card, or Add to Dashboard to keep a chart.