
Before you start
- You can connect each tool read-only. Each connector page lists the credentials it needs. The Kubernetes connector uses a read-only service account; the others take an API key, a token or a read-only user.
- You manage agents. Creating agents and accepting training changes needs the manage permission on the agent.
Step 1: Create the agent and pick its data
Add a connection for each tool, then create one agent that uses all of them. One agent matters here: following an alert from the deploy to the pods to the logs only works if a single agent can see every source. Open Agents → New → Agent. Enter a Name, such as Incident RCA, and pick all four connections under Connections. You can create a missing connection from the same picker with Create new connection.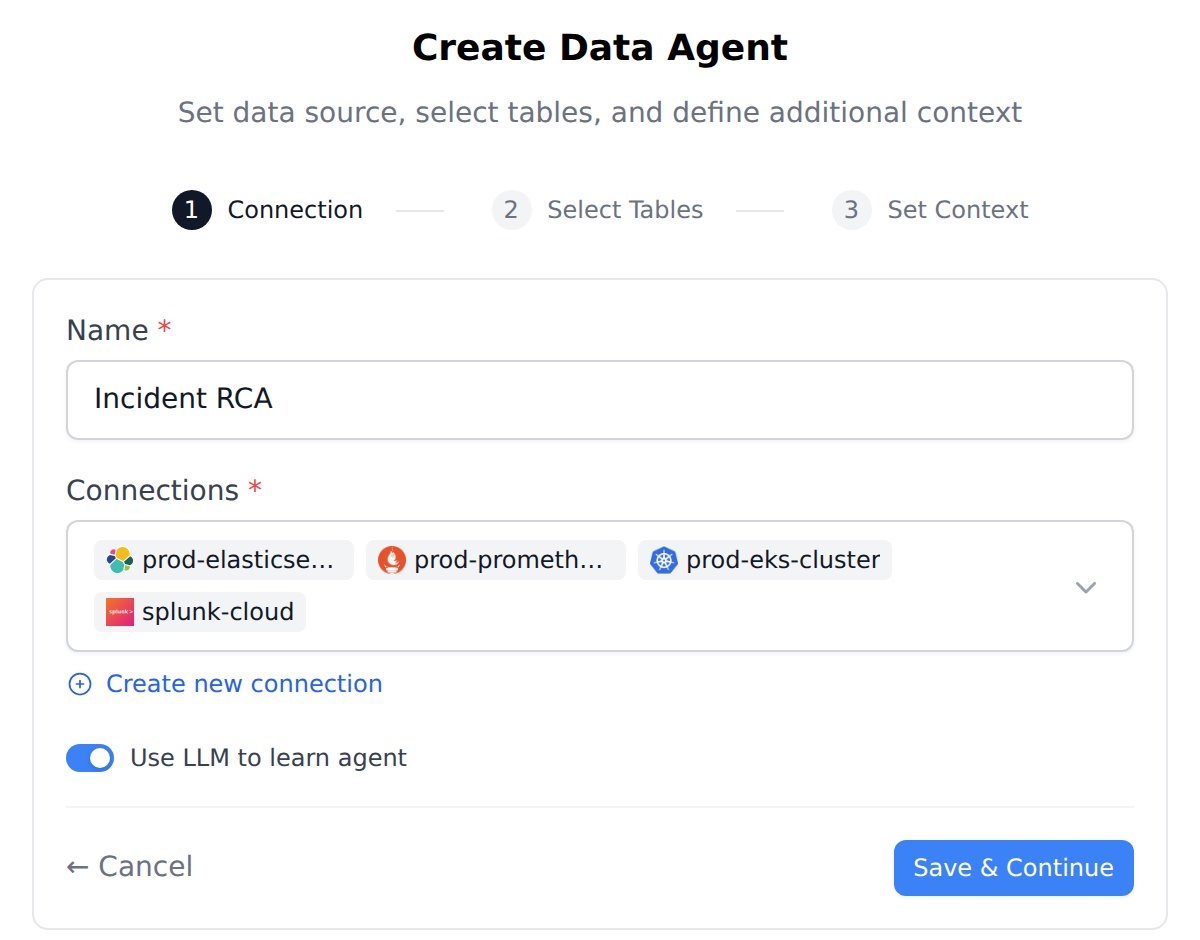
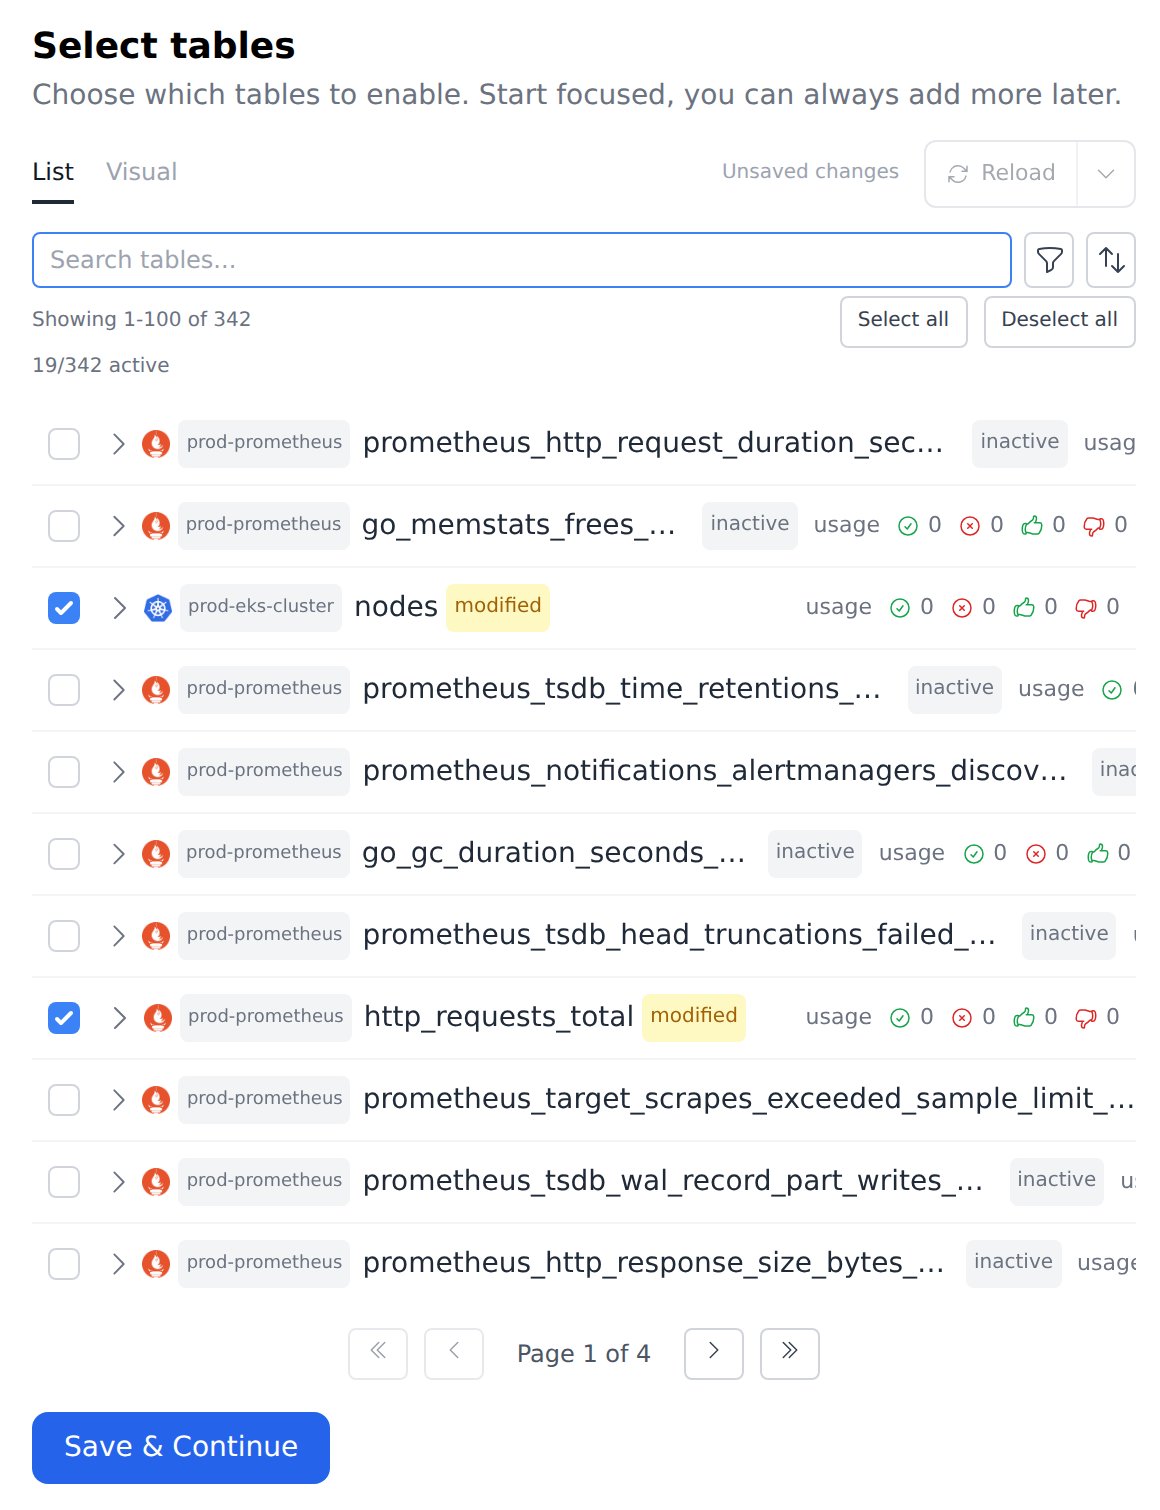
Click Save & Continue. On Set Context, BOW drafts an overview from samples of your data. Keep it to a short description of what the agent is for. The training session in Step 2 adds the details, with evidence.
Step 2: Train the agent on how your data fits together
Start a new report with the agent and switch the mode from Chat to Training. Then ask the agent to inspect every source before it writes anything:Inspect each of the four sources before we write anything. For each one, sample recent data and tell me where things live (index, metric, table or sourcetype), how a service, a pod and a point in time are identified, and which fields matter for errors, latency, restarts and deploys. Then map how the same service and pod show up across all four sources, check that mapping against the actual data (for example, do the pod names and IPs match?), and propose instructions for what you learn.The agent samples each source in parallel, checks the joins, and writes up what it found. In this run it confirmed that pod names match across Elasticsearch, Prometheus and Kubernetes. It found that the ingress logs only cover the frontend, and that the
upstream_addr field is the frontend pod’s IP with :8080 added.
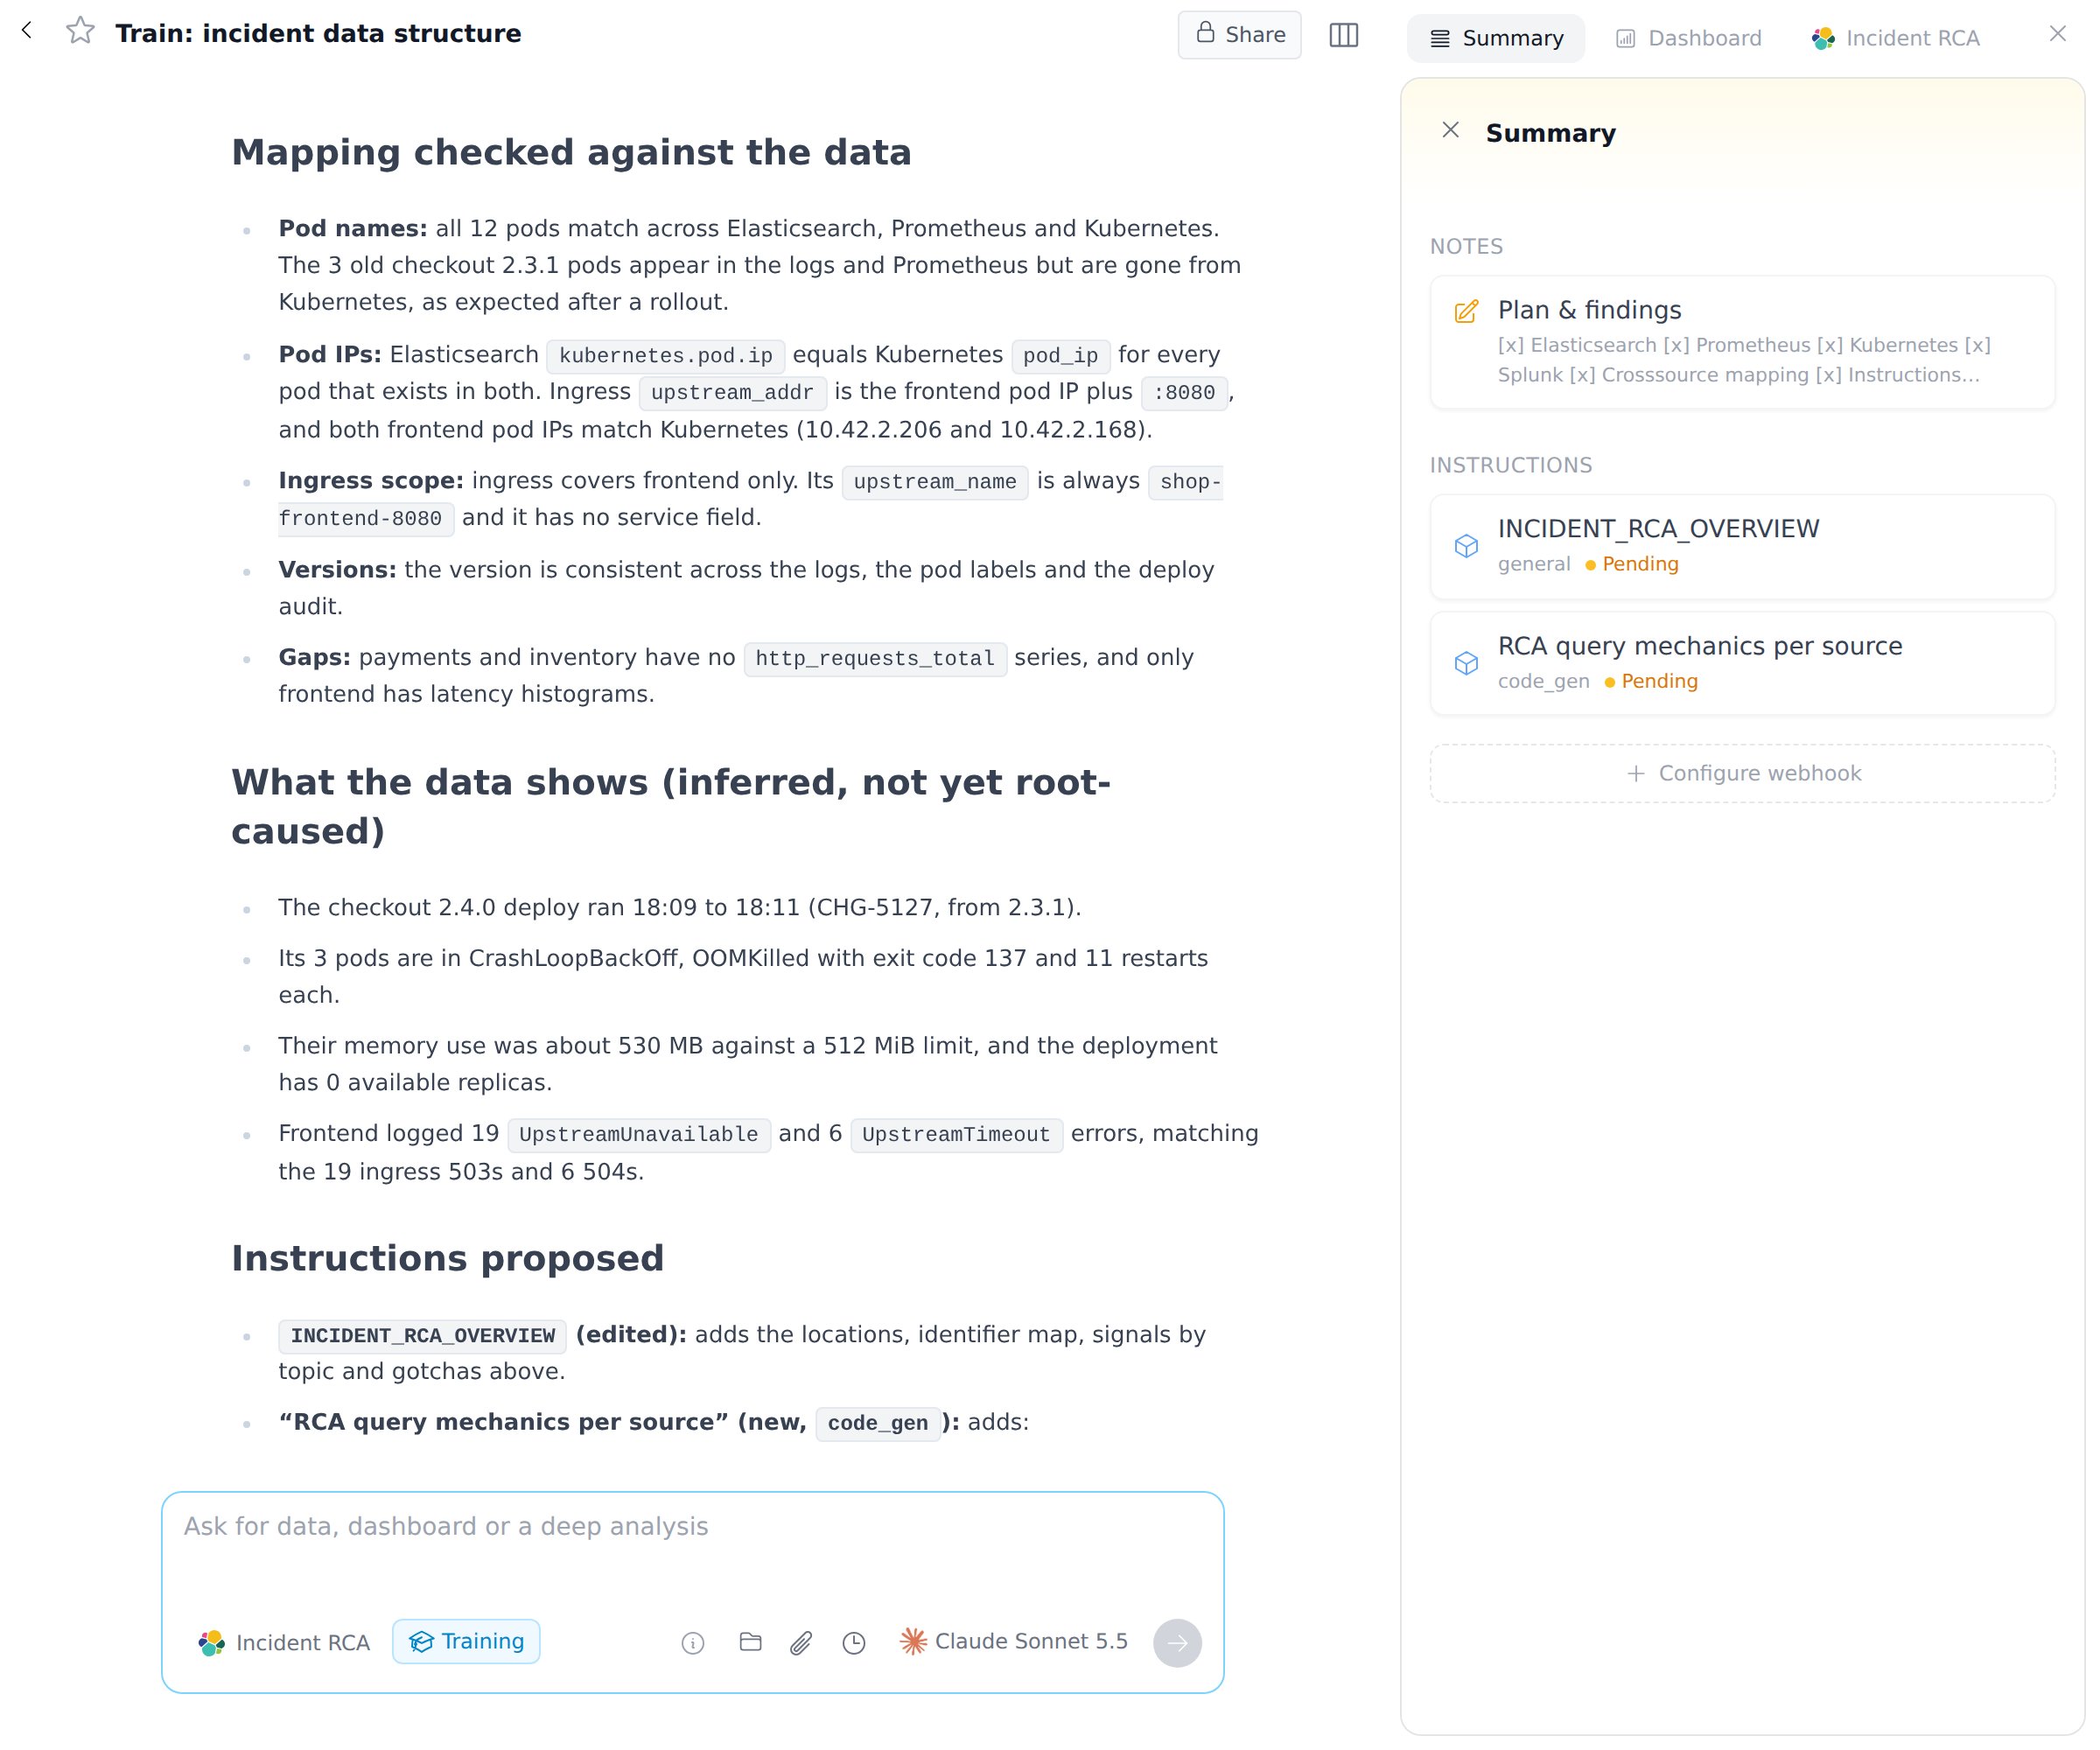
message.keyword”. Review each card and click Accept all or Accept. See Train an agent for how review cards work.
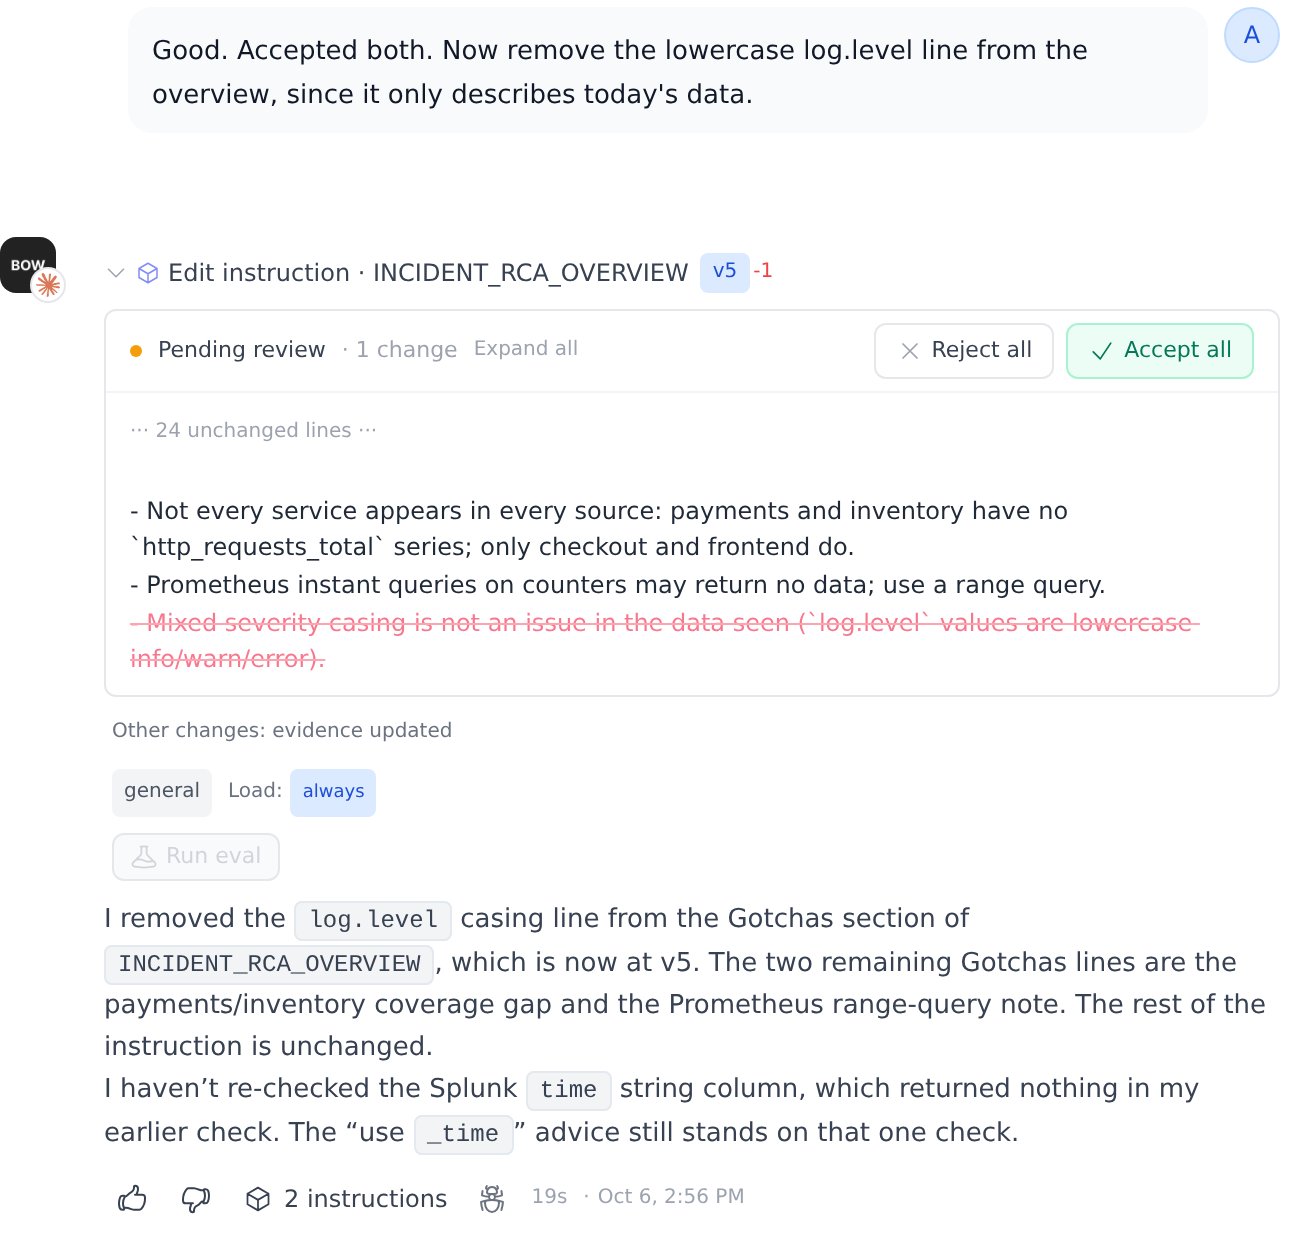
Read the end of the answer too. The agent lists what it could not confirm, and flags rules that may only describe today’s data. Here it pointed out that one line (“log.level values are lowercase”) described one day of logs, not a rule. Ask it to fix that in the same session:
Good. Accepted both. Now remove the lowercase log.level line from the overview, since it only describes today’s data.
Step 3: Add conventions every agent follows
Some rules are not about one agent’s data. They are how your team expects any investigation to be reported. Put these in a global instruction, so every agent follows them, including agents you add later. Open Agents → New → Instruction. Leave Agents on All agents, keep Load on Always, and write the conventions: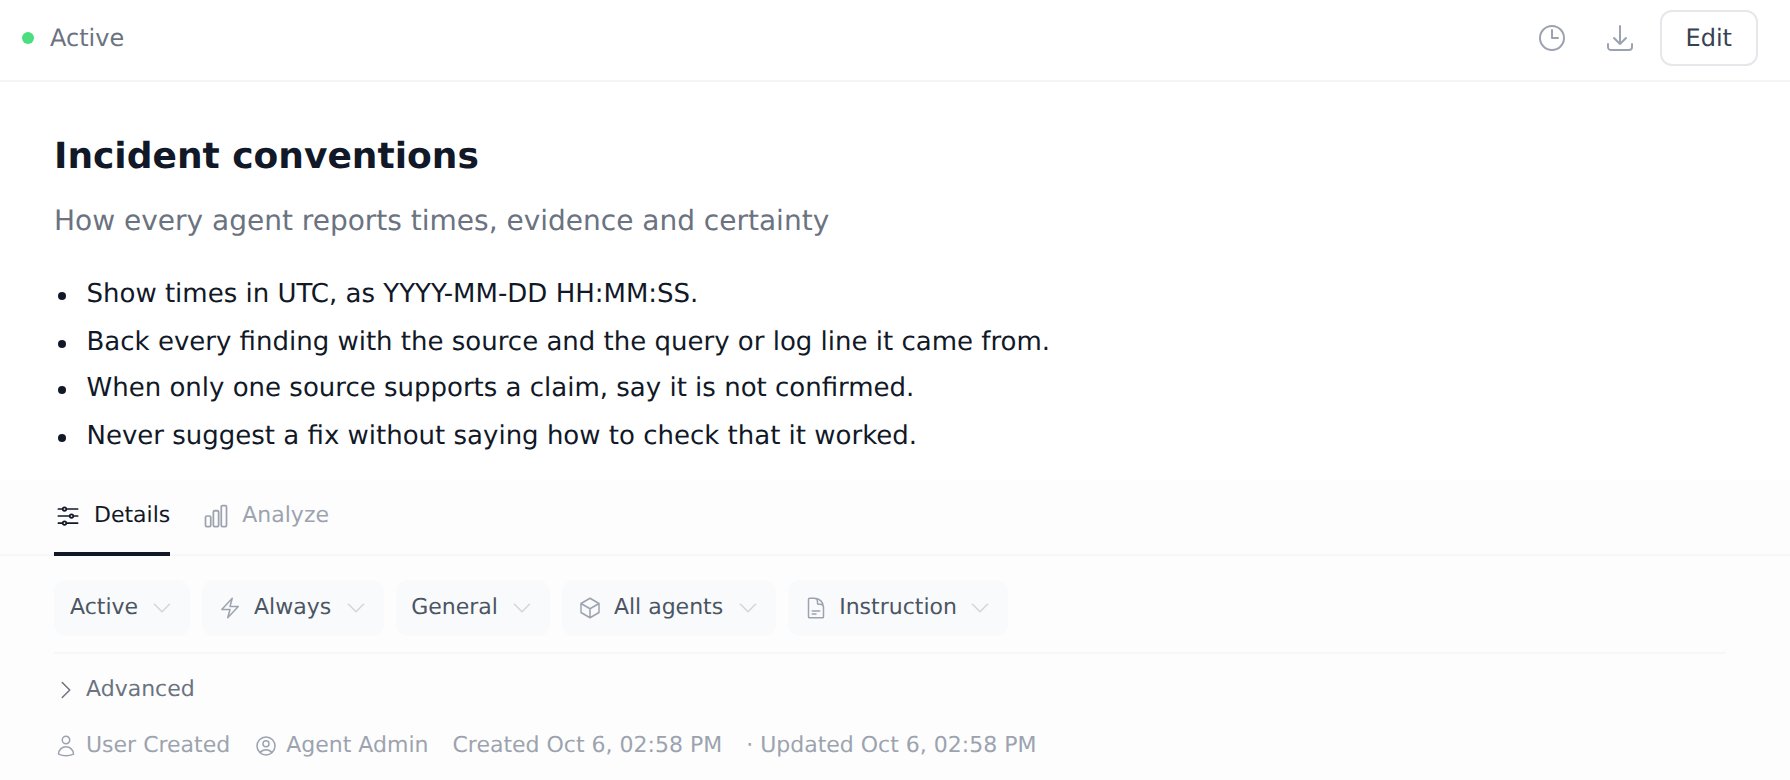
Step 4: Write your RCA playbook as a skill
The data can’t tell the agent what to check first when something breaks. That comes from your team’s experience, so write it down as a playbook. Create another instruction, set its type from Instruction to Skill, and leave Agents on All agents. A skill loads when it’s relevant: the agent sees its title and description, and reads the full text when a task calls for it. The description decides when it gets used, so make it specific: Use when investigating an alert, outage, error spike, latency spike or crash. Here is the playbook from this example. Copy it and change the sources and steps to match your stack:Step 5: Investigate an alert
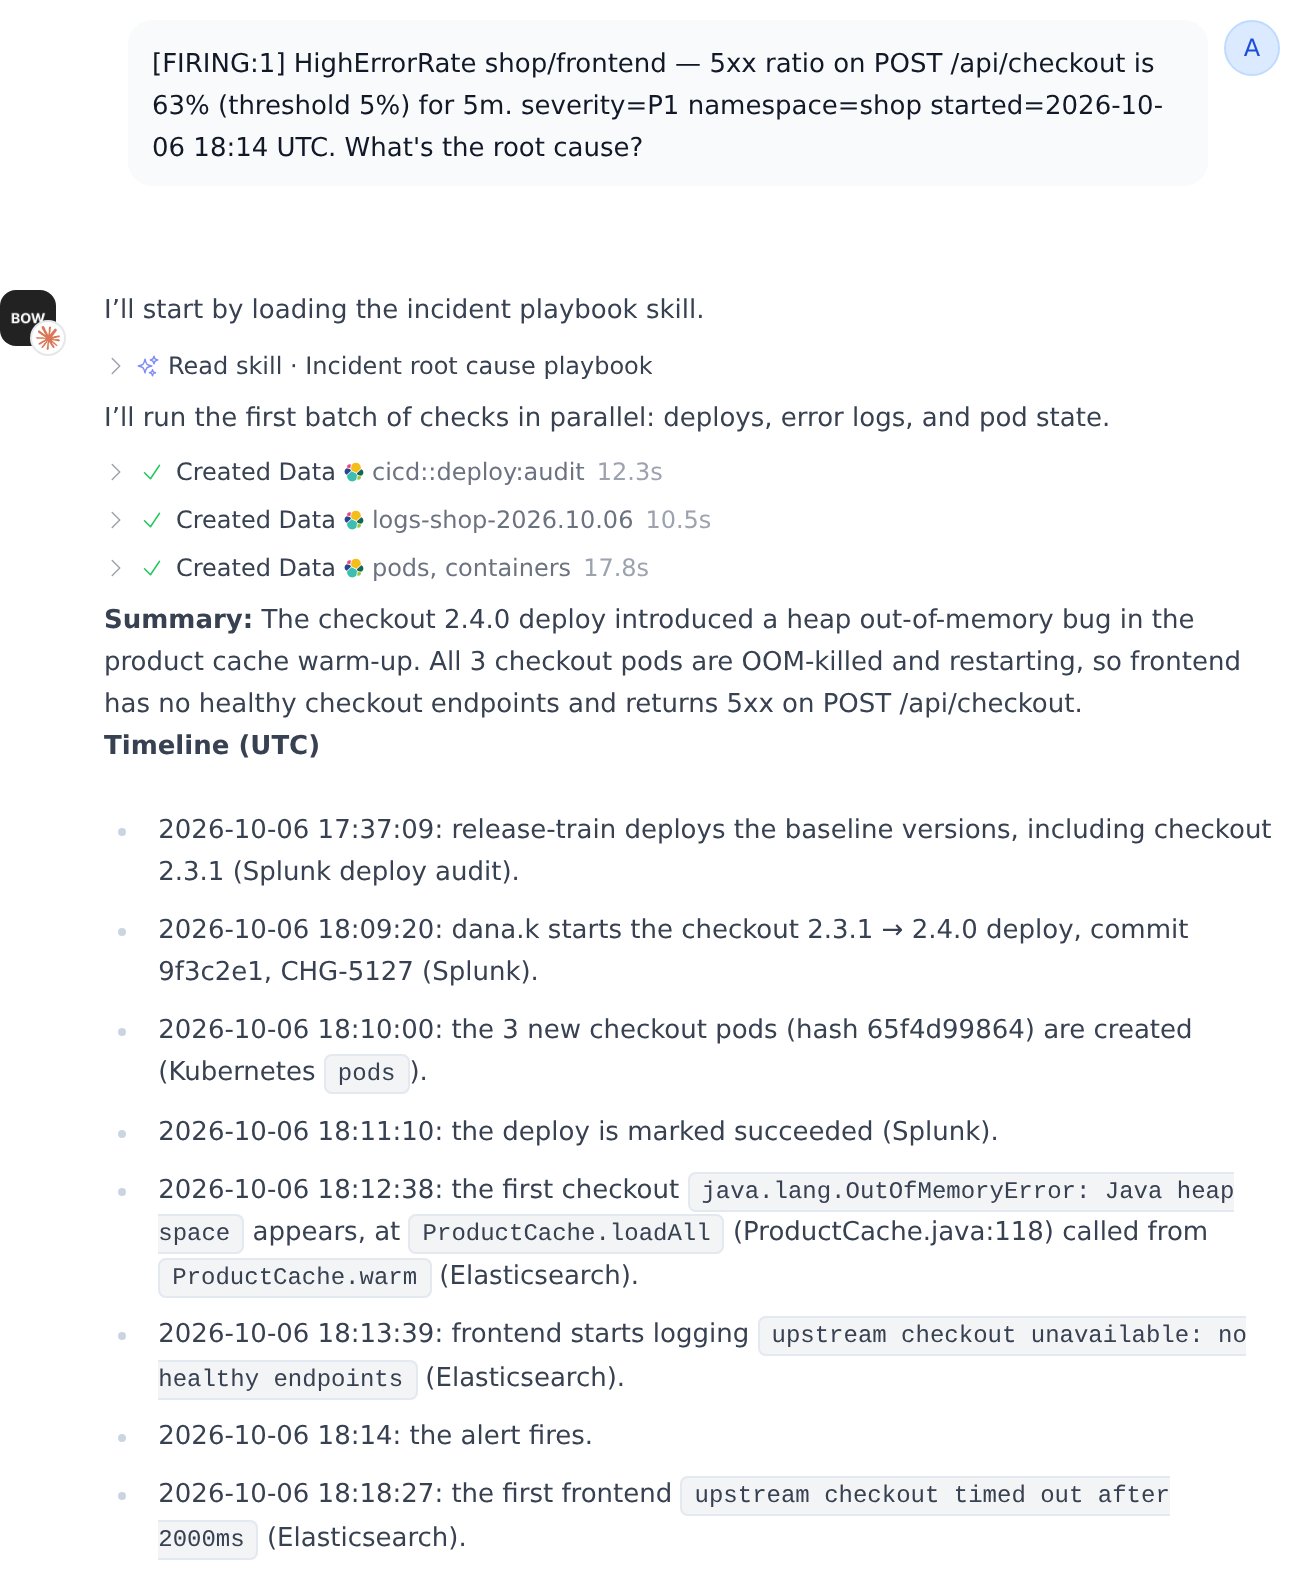
Start a new report with the agent in Chat mode and paste the alert:[FIRING:1] HighErrorRate shop/frontend — 5xx ratio on POST /api/checkout is 63% (threshold 5%) for 5m. severity=P1 namespace=shop started=2026-10-06 18:14 UTC. What’s the root cause?The agent reads the playbook, then checks the deploy audit, the error logs and the pod state in parallel (shown at the top of this page). In under a minute it answered in the playbook’s format:
- Summary. The checkout 2.4.0 deploy introduced an out-of-memory bug in the product cache warm-up. All three checkout pods are OOM-killed and restarting, so the frontend has no healthy checkout endpoints.
- Timeline, each line with its source. Deploy started at 18:09:20 (Splunk). New pods at 18:10:00 (Kubernetes). First
OutOfMemoryErrorat 18:12:38 (Elasticsearch). First frontend “no healthy endpoints” error at 18:13:39 (Elasticsearch). Alert at 18:14. - Root cause and evidence. OOM errors in the logs,
OOMKilledwith exit code 137 and 11 restarts on every new pod, and the cause comes before the symptom. - Fix. Roll back to 2.3.1, and how to check that it worked.
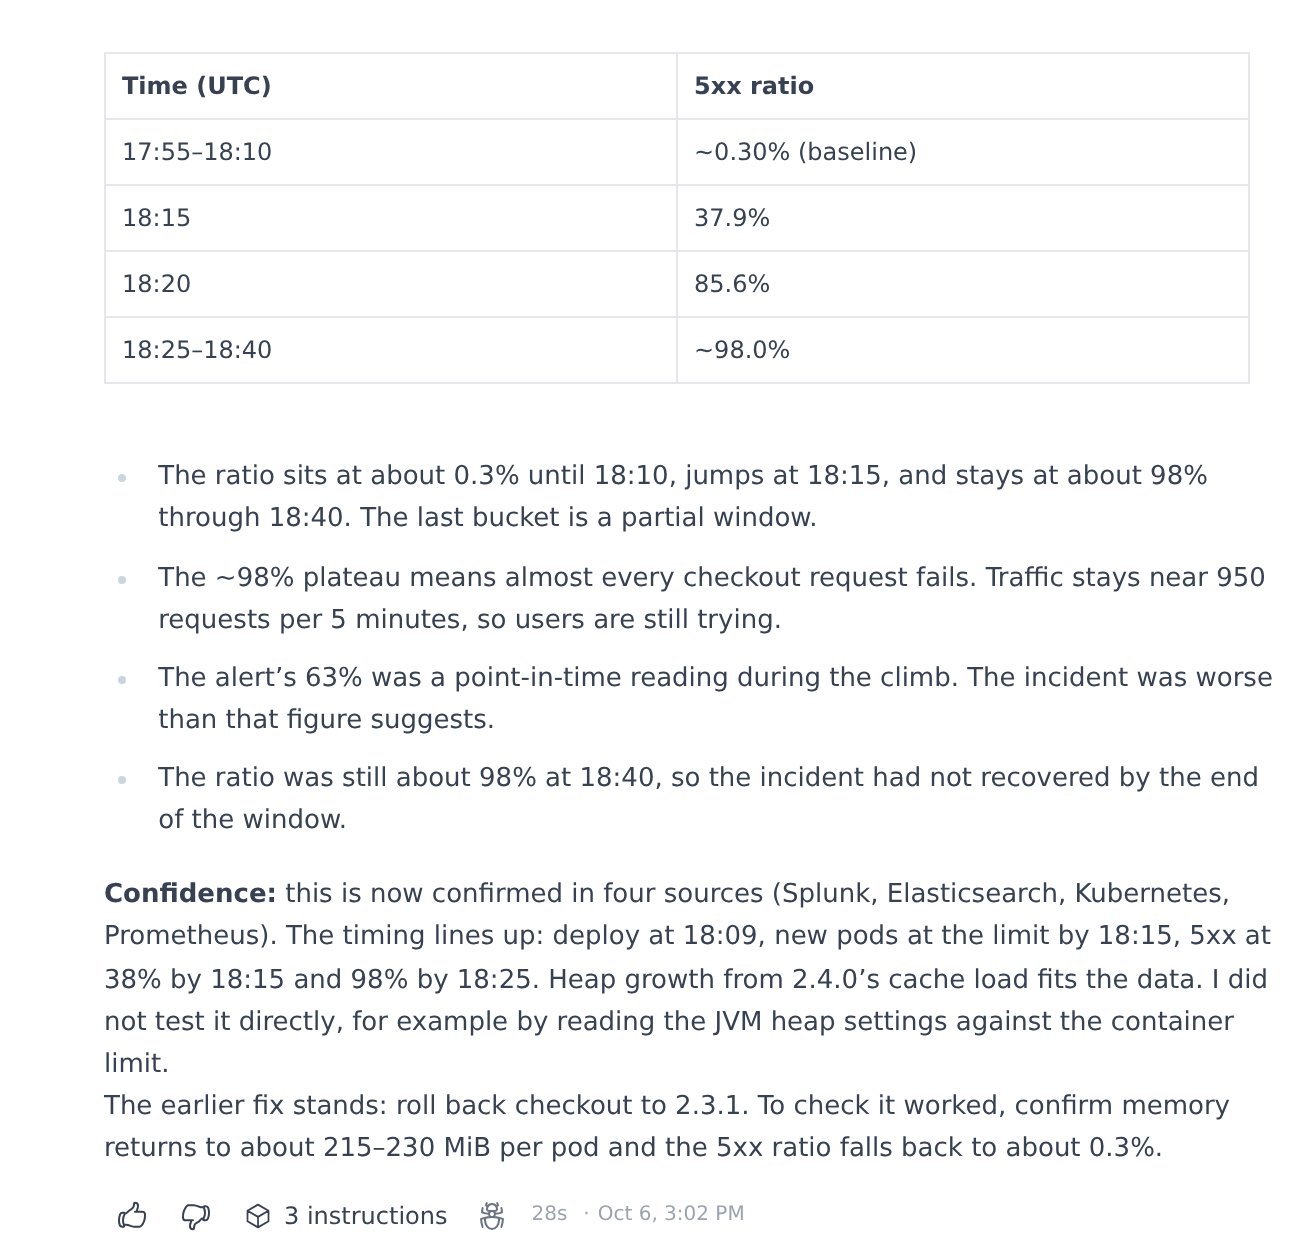
Confirm it in Prometheus. Chart checkout memory against its limit, and the 5xx ratio on /api/checkout, from 17:50 to 18:40 UTC.
Step 6: Improve the playbook from what you see
Each investigation shows you what to add. In this run the first answer skipped Prometheus, even though the playbook mentions it for crashes. If a step should never be skipped, say so in the playbook. Open the skill, click Edit, and add a line under Confirm before you name a cause: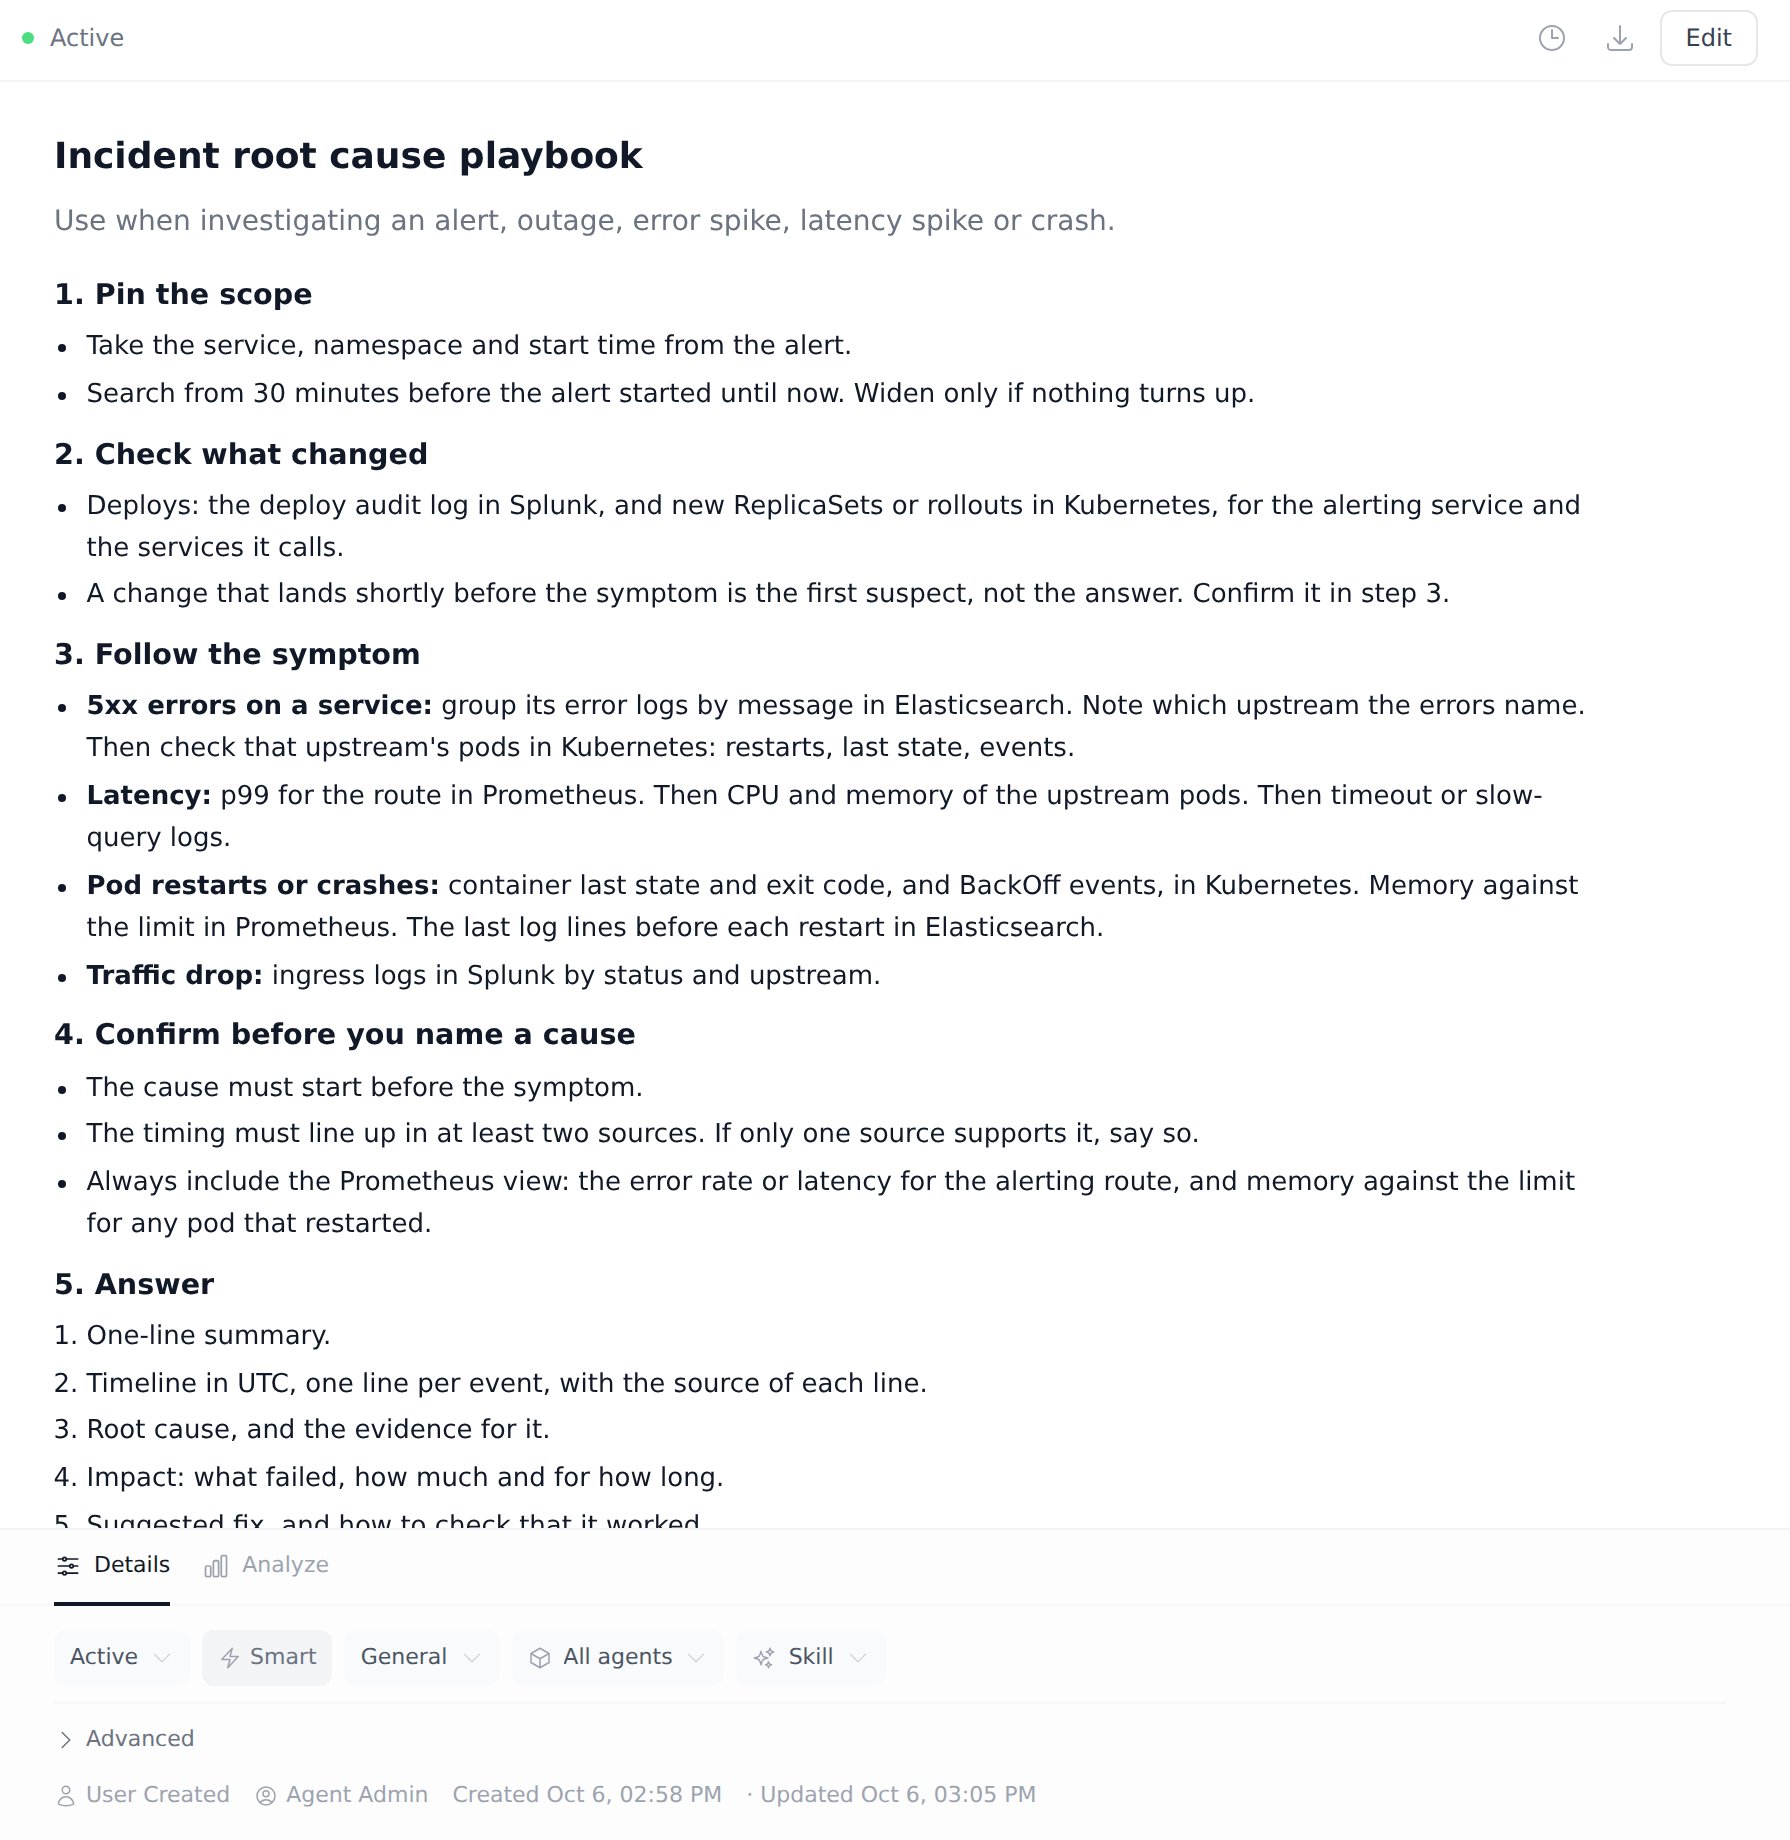
Tips
- Start from real alerts. Replay two or three past incidents where you know the root cause. Check that the agent finds the same cause, from the same evidence.
- Keep time windows tight. Ask about a specific window. “Last hour” on a busy cluster returns more data than the agent needs.
- Expect some variation. The agent writes new queries each run, and one can come back empty. A clear playbook and the “say it is not confirmed” convention keep that visible instead of hidden.
- Send alerts automatically. Give your alerting tool a trigger URL, and each alert starts an investigation like the one above. See Run an automated analysis from an external trigger.
- Lock it in with evals. Turn a past incident into an eval, so a later change that breaks the investigation shows up. See Test an agent with evals.
Related
Train an agent
Run a training session and review every change.
Tips for training an agent
What to teach, and where each rule belongs.
Observability connectors
Connect Splunk, Elasticsearch and Prometheus.
Kubernetes
Connect a cluster with a read-only service account.