> ## Documentation Index
> Fetch the complete documentation index at: https://docs.bagofwords.com/llms.txt
> Use this file to discover all available pages before exploring further.
# Build a dashboard with parameterized queries
> Ask an agent for a dashboard with filters, add more filters in chat, and reuse the parameterized queries behind it.
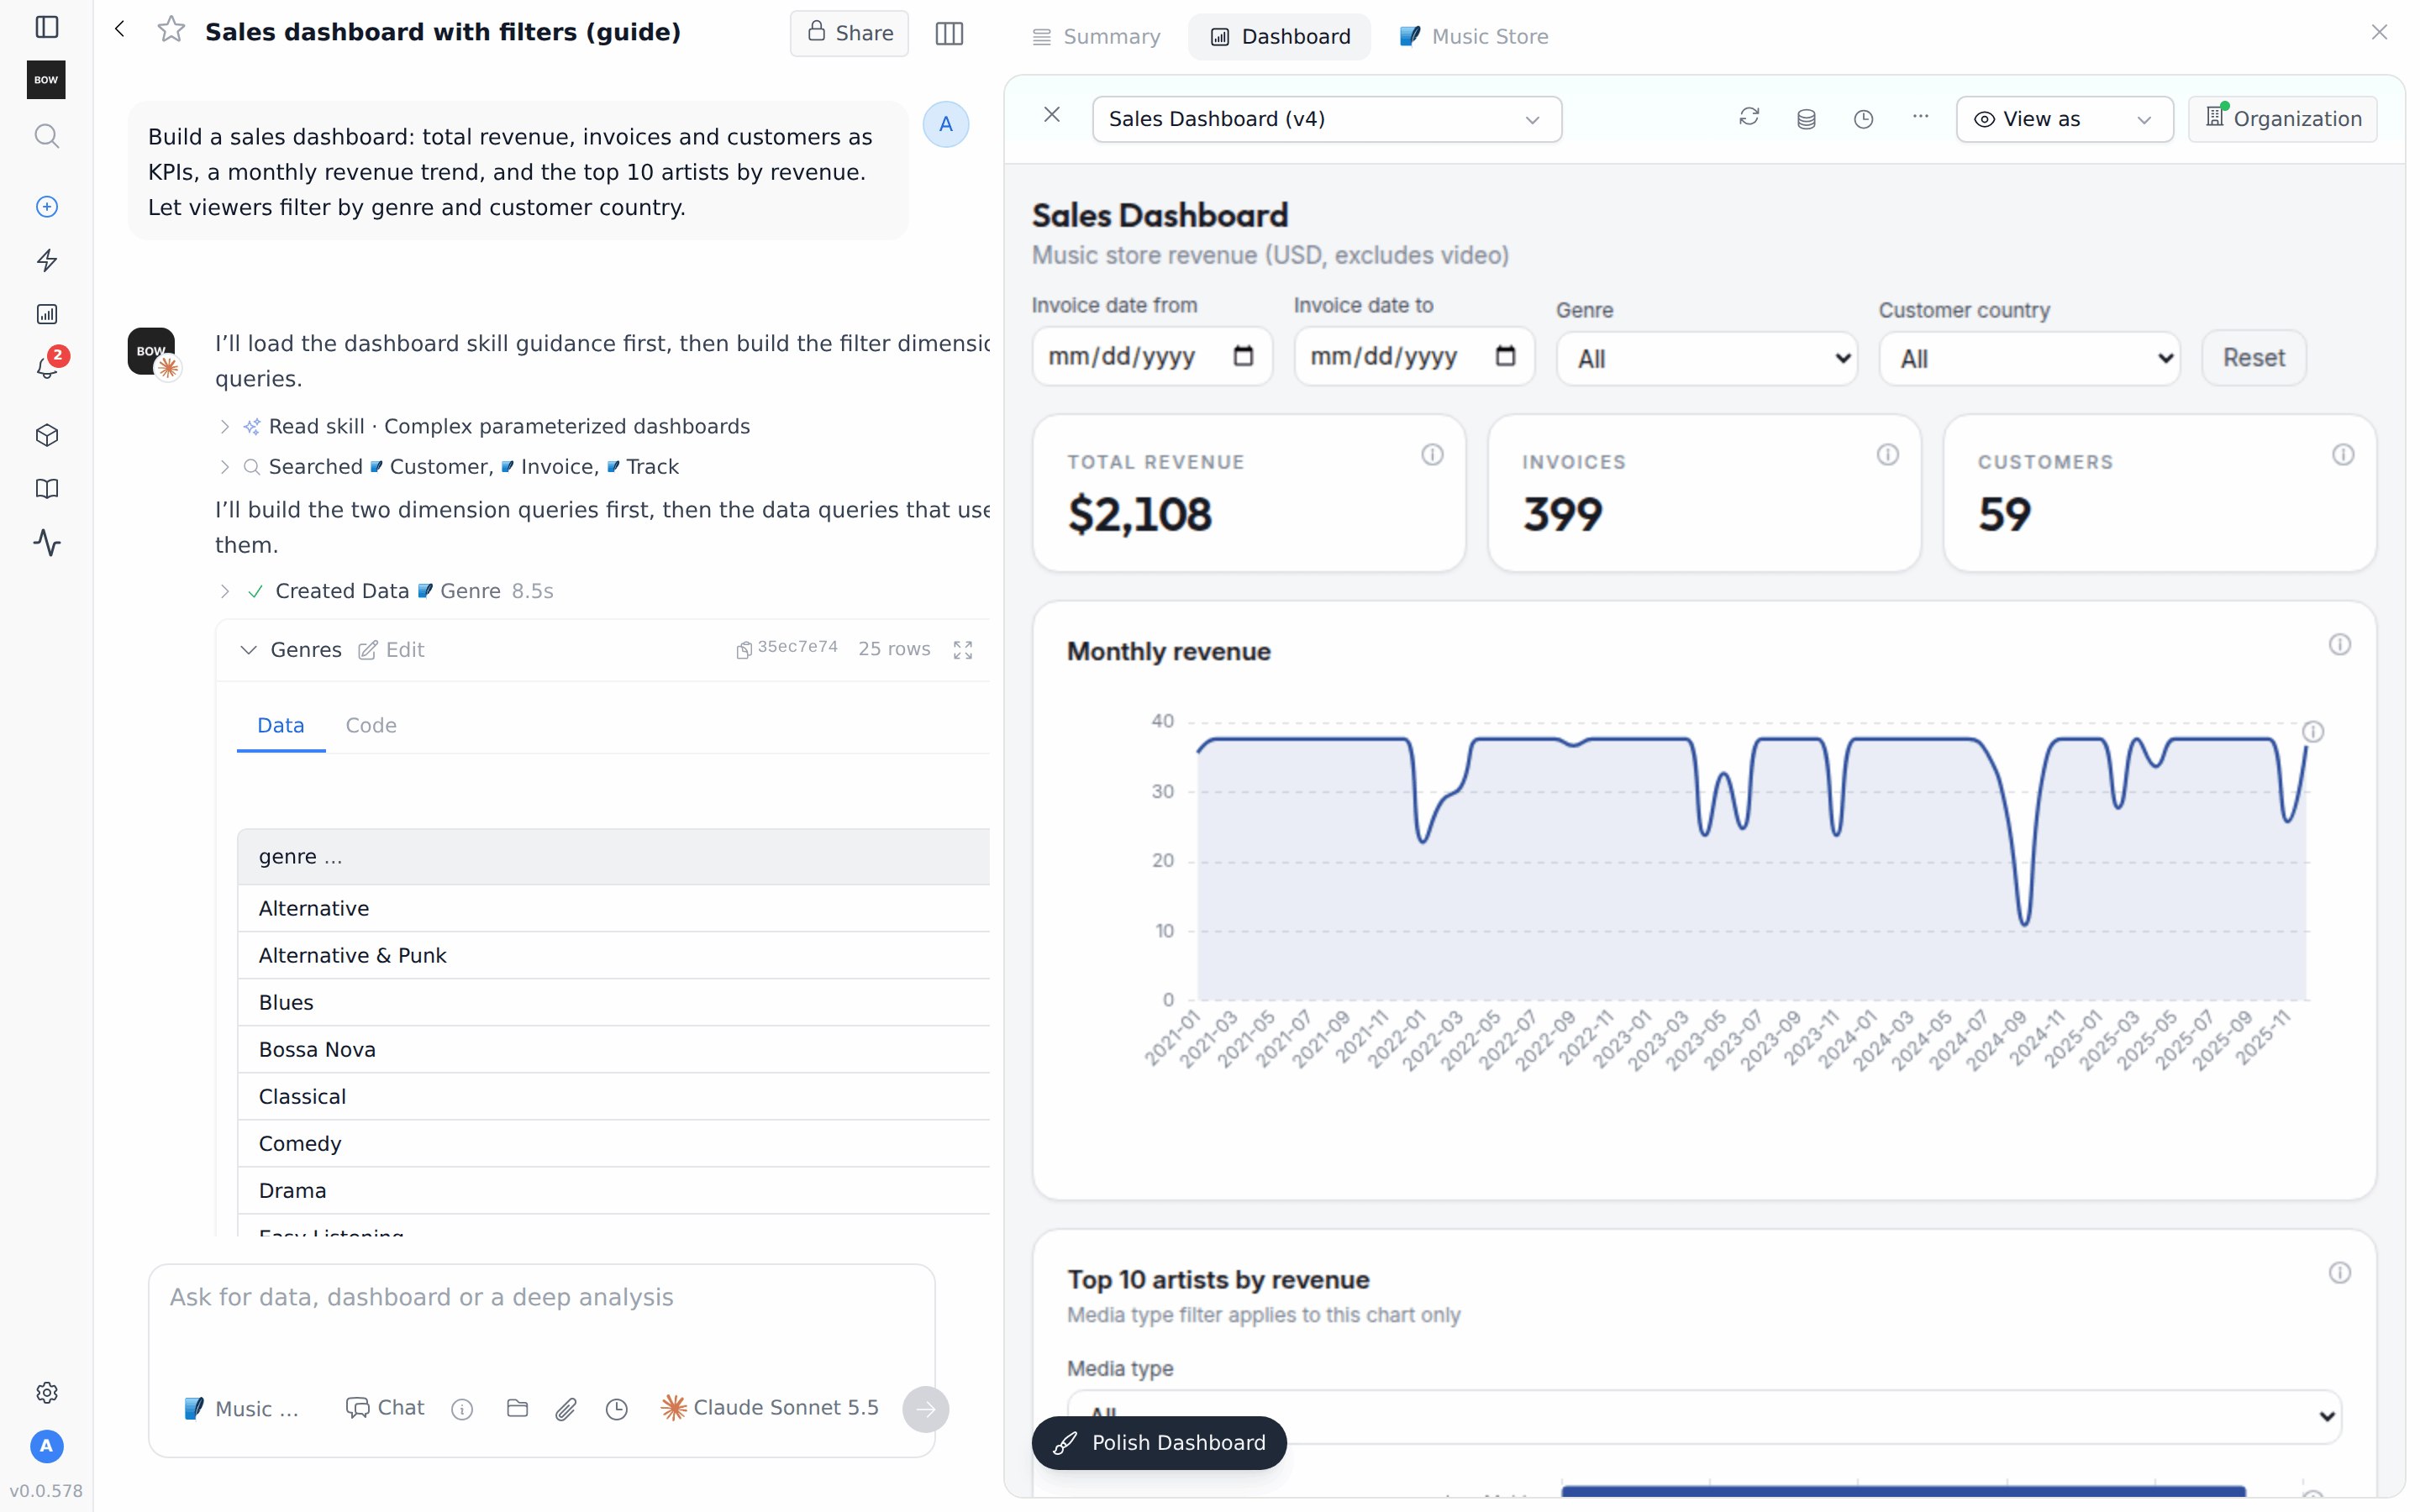
A filtered dashboard is a dashboard whose queries take **parameters**. You ask for the filters in plain language. The agent declares a parameter on each query and adds the filter controls to the dashboard. When a viewer changes a filter, the queries run again on the data source with the new values.
 ## Before you start
* **An agent with data.** This guide uses the **Music Store** demo agent. Its invoices run from January 2021 to December 2025.
* **You can chat with the agent.** Filters are added by the agent, so you need access to the agent in a report.
## Step 1: Ask for a dashboard with filters
Start a new report with the agent and say which filters viewers need:
> *Build a sales dashboard: total revenue, invoices and customers as KPIs, a monthly revenue trend, and the top 10 artists by revenue. Let viewers filter by genre and customer country.*
The agent works in this order:
1. It builds one small query per filter that lists the choices: **Genres** and **Customer Countries**.
2. It builds the data queries (KPIs, monthly revenue, top artists). Each one declares a `genre` and a `country` parameter. Each parameter takes its choices from the matching list query.
3. It creates the dashboard and opens it beside the chat. The dashboard has a dropdown for each filter.
4. It opens the dashboard and tries each filter to check that the queries run again.
## Before you start
* **An agent with data.** This guide uses the **Music Store** demo agent. Its invoices run from January 2021 to December 2025.
* **You can chat with the agent.** Filters are added by the agent, so you need access to the agent in a report.
## Step 1: Ask for a dashboard with filters
Start a new report with the agent and say which filters viewers need:
> *Build a sales dashboard: total revenue, invoices and customers as KPIs, a monthly revenue trend, and the top 10 artists by revenue. Let viewers filter by genre and customer country.*
The agent works in this order:
1. It builds one small query per filter that lists the choices: **Genres** and **Customer Countries**.
2. It builds the data queries (KPIs, monthly revenue, top artists). Each one declares a `genre` and a `country` parameter. Each parameter takes its choices from the matching list query.
3. It creates the dashboard and opens it beside the chat. The dashboard has a dropdown for each filter.
4. It opens the dashboard and tries each filter to check that the queries run again.
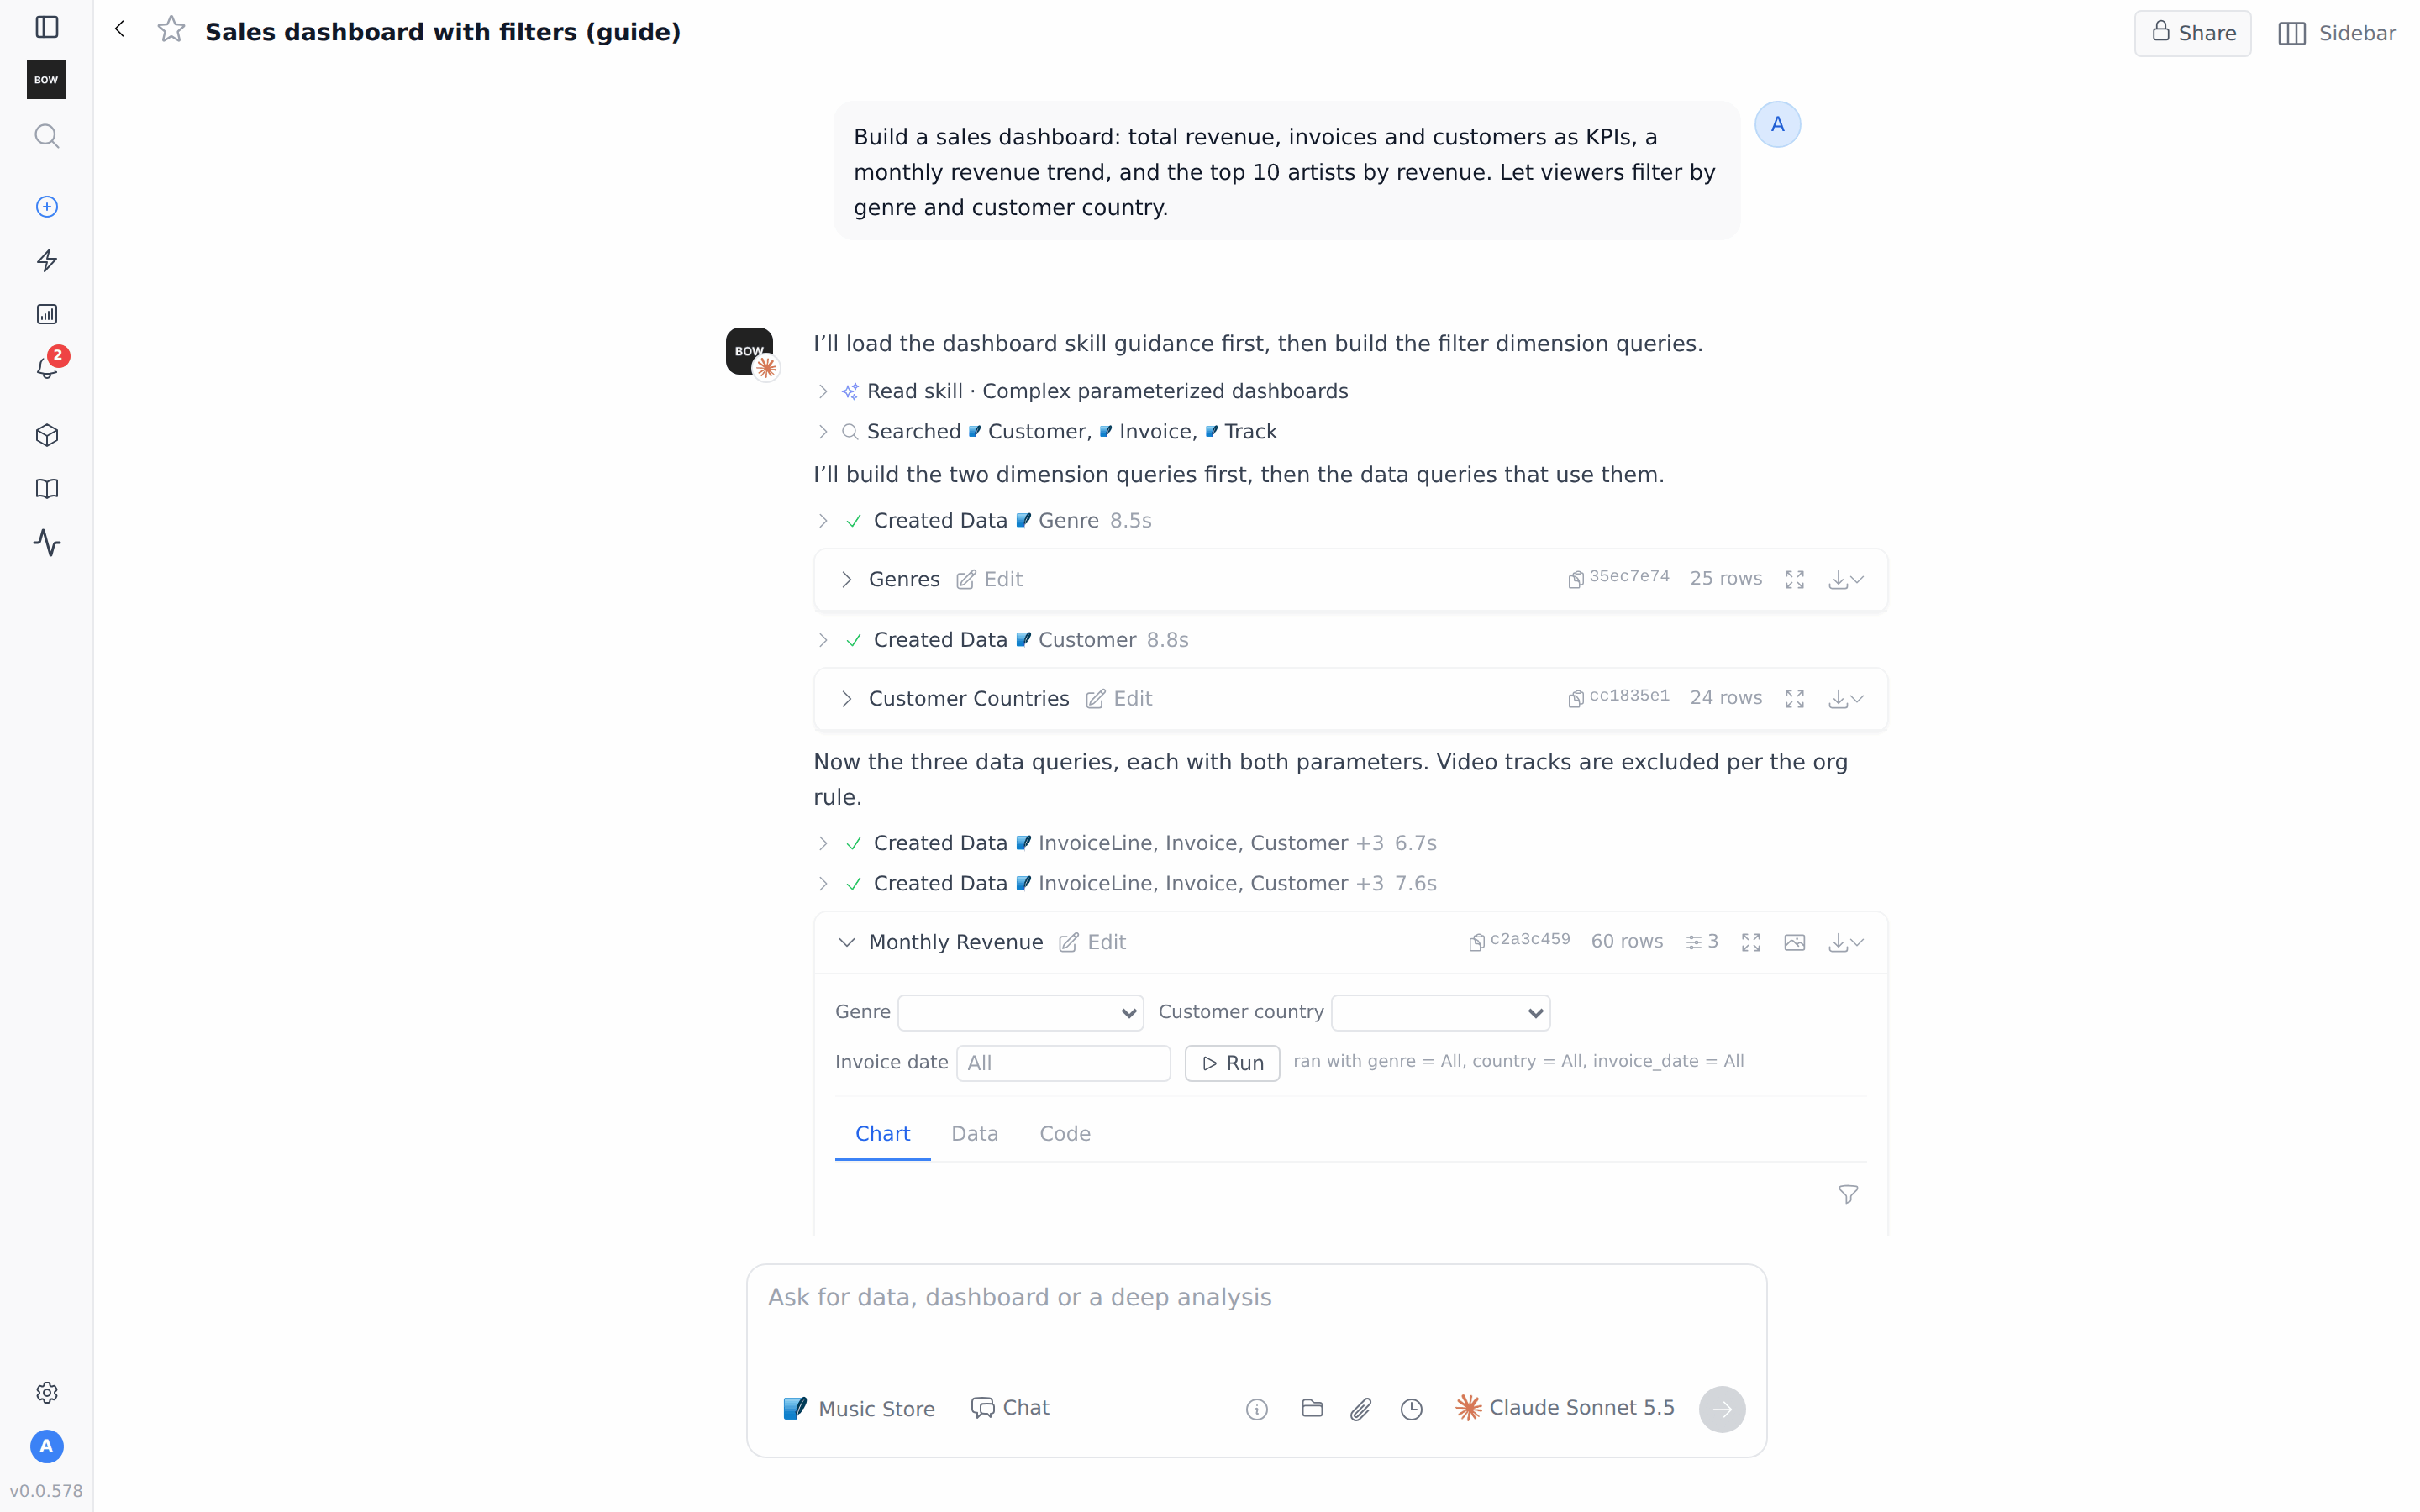 The choices come from separate list queries, not from the rows that a filter narrows down. If you pick **Rock**, every other genre is still in the list.
## Step 2: Filter the dashboard
Pick a value in a dropdown. Each chart that uses that parameter runs again on the data source with the new value. With **Genre** set to **Rock** and **Customer country** set to **Brazil**, the KPIs drop from $2,108, 399 invoices and 59 customers to $80.19, 22 invoices and 5 customers.
The choices come from separate list queries, not from the rows that a filter narrows down. If you pick **Rock**, every other genre is still in the list.
## Step 2: Filter the dashboard
Pick a value in a dropdown. Each chart that uses that parameter runs again on the data source with the new value. With **Genre** set to **Rock** and **Customer country** set to **Brazil**, the KPIs drop from $2,108, 399 invoices and 59 customers to $80.19, 22 invoices and 5 customers.
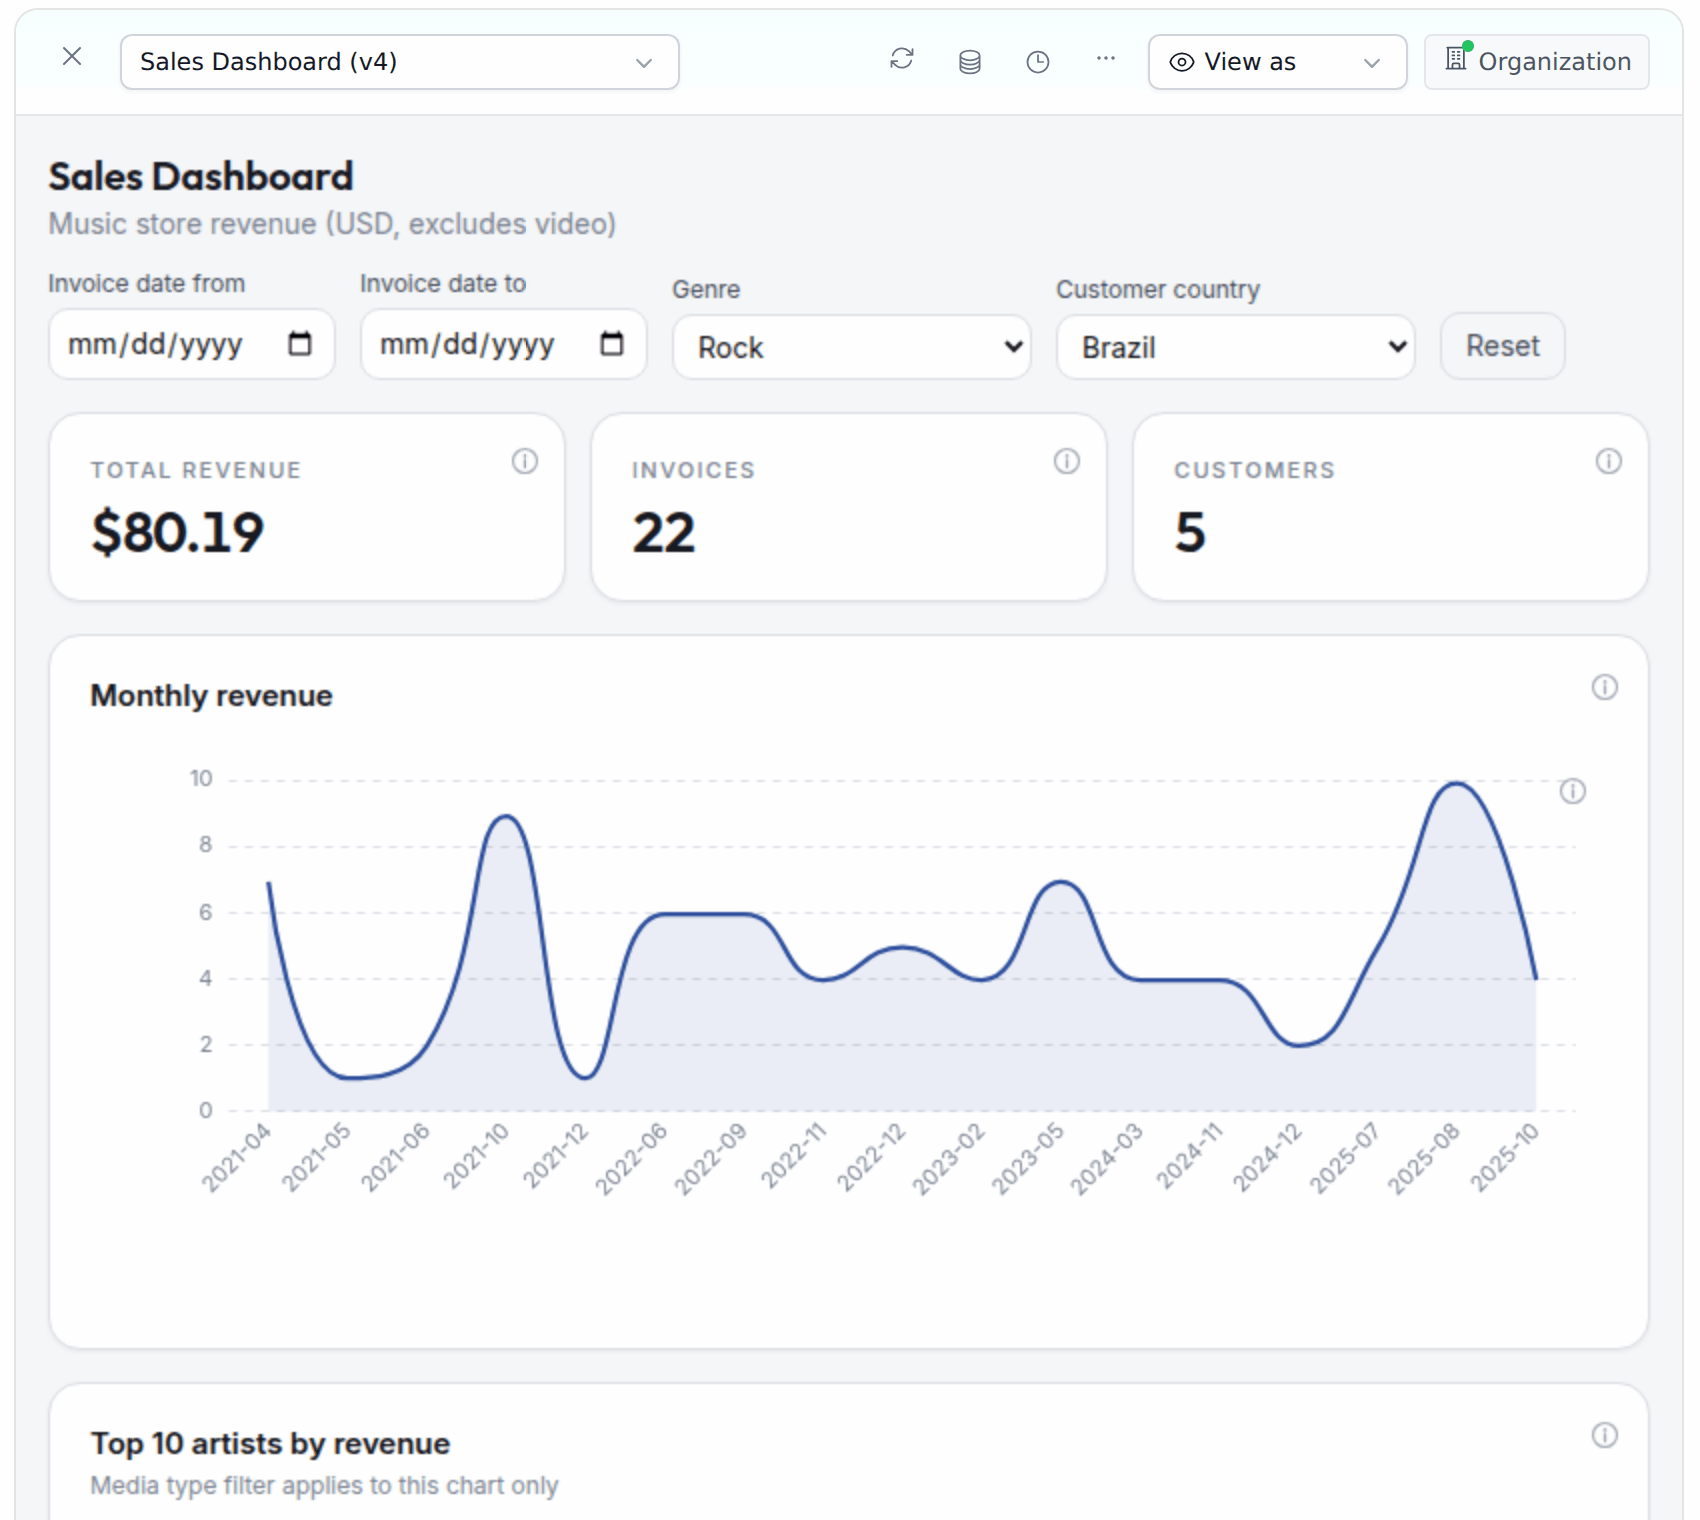 The report's address keeps your filter values, for example `…/reports/?qp_genre=Rock&qp_country=Brazil`. If you open that address again, the dashboard loads with the same filters. **Reset** clears all filters.
The link you copy from **Share Dashboard** (`/r/`) always opens with no filters set. It ignores `qp_` values, so you can't use it to share a filtered view yet.
## Step 3: Add a filter that drives every chart
Ask for more filters in the same chat:
> *Add a date range filter on invoice date that drives every chart.*
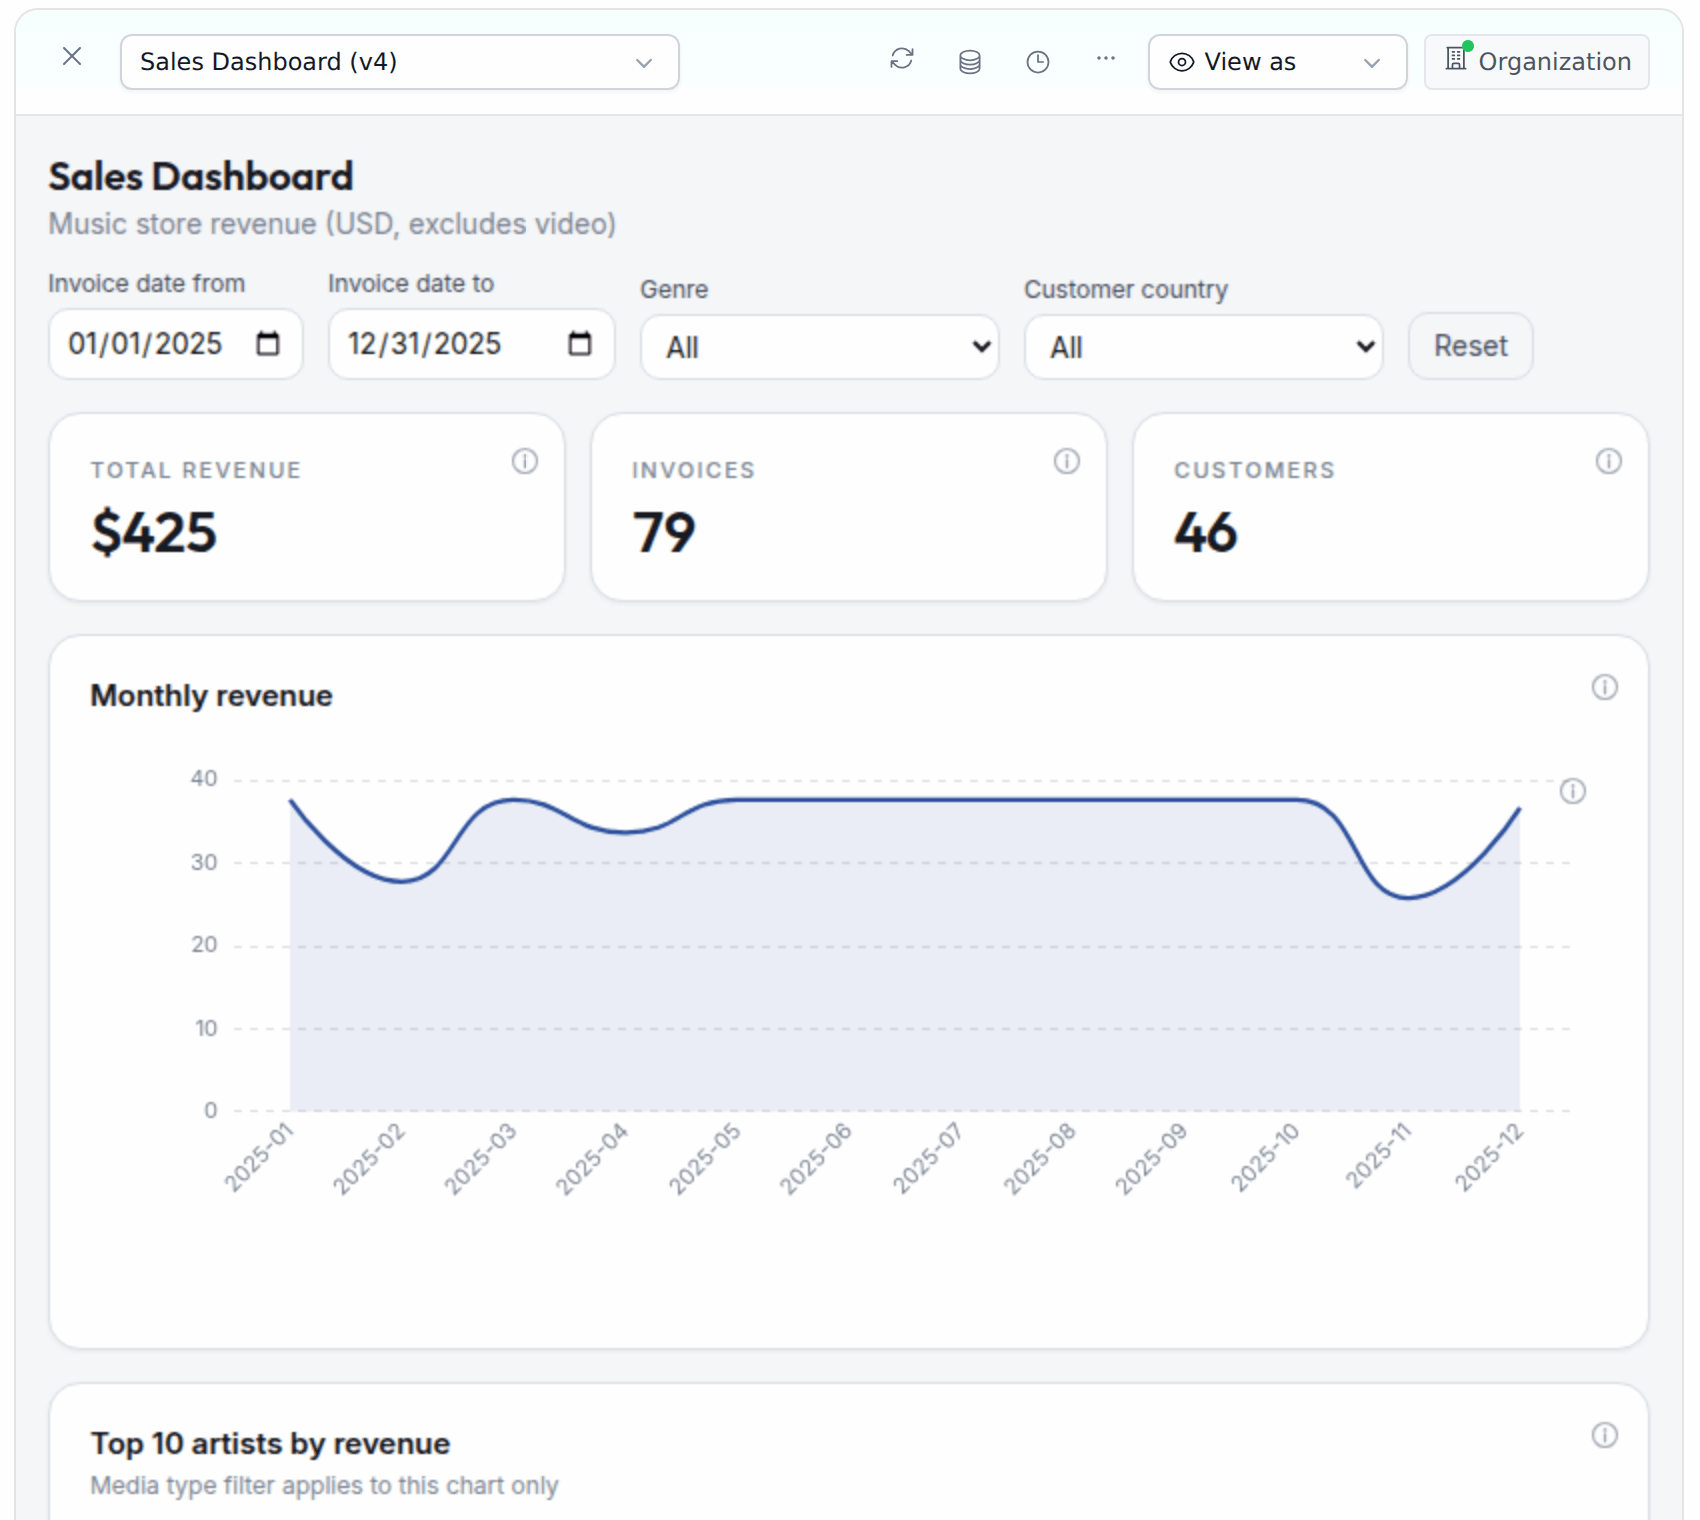
The agent adds a `date_range` parameter to each data query, updates the SQL, and adds **Invoice date from** and **Invoice date to** pickers to the dashboard. With both dates set to 2025, the KPIs show \$425, 79 invoices and 46 customers. The monthly trend shows only the 12 months of 2025.
The report's address keeps your filter values, for example `…/reports/?qp_genre=Rock&qp_country=Brazil`. If you open that address again, the dashboard loads with the same filters. **Reset** clears all filters.
The link you copy from **Share Dashboard** (`/r/`) always opens with no filters set. It ignores `qp_` values, so you can't use it to share a filtered view yet.
## Step 3: Add a filter that drives every chart
Ask for more filters in the same chat:
> *Add a date range filter on invoice date that drives every chart.*
The agent adds a `date_range` parameter to each data query, updates the SQL, and adds **Invoice date from** and **Invoice date to** pickers to the dashboard. With both dates set to 2025, the KPIs show \$425, 79 invoices and 46 customers. The monthly trend shows only the 12 months of 2025.
 ## Step 4: Add a filter to one chart only
A filter doesn't have to apply to every chart. Name the query it belongs to:
> *Add a media type filter to the top artists query.*
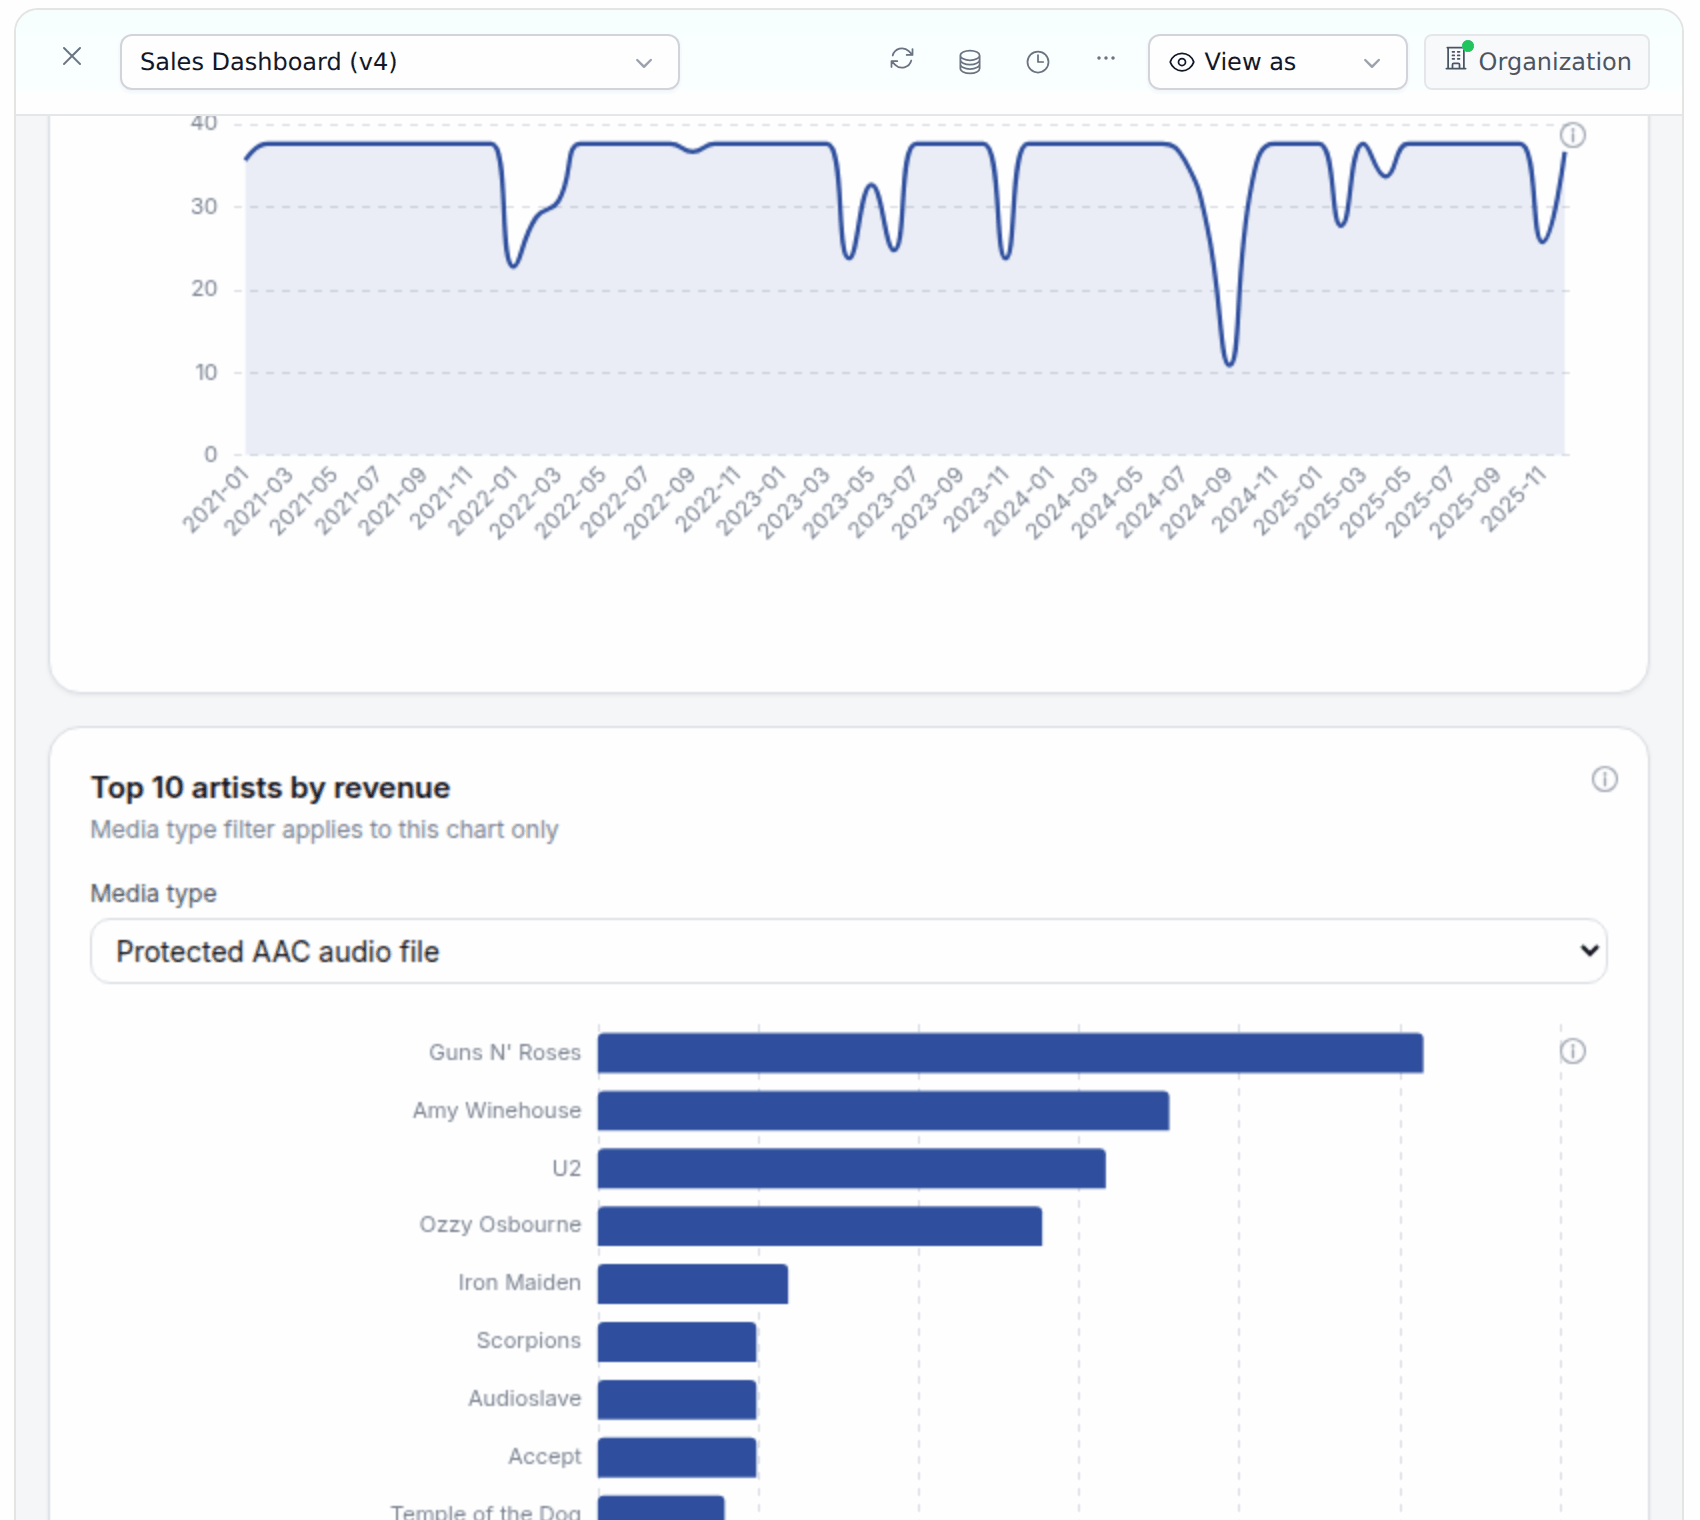
The agent adds a **Media type** dropdown inside the **Top 10 artists by revenue** card. Its choices come from a new **Media Types** list query. Pick **Protected AAC audio file**, and the top artists change while the monthly revenue chart stays the same.
## Step 4: Add a filter to one chart only
A filter doesn't have to apply to every chart. Name the query it belongs to:
> *Add a media type filter to the top artists query.*
The agent adds a **Media type** dropdown inside the **Top 10 artists by revenue** card. Its choices come from a new **Media Types** list query. Pick **Protected AAC audio file**, and the top artists change while the monthly revenue chart stays the same.
 ## Step 5: Ask questions with different values
A filter changes what one person sees on the dashboard. To get a quick answer for a different value, ask in chat:
> *What was revenue for Rock in Brazil?*
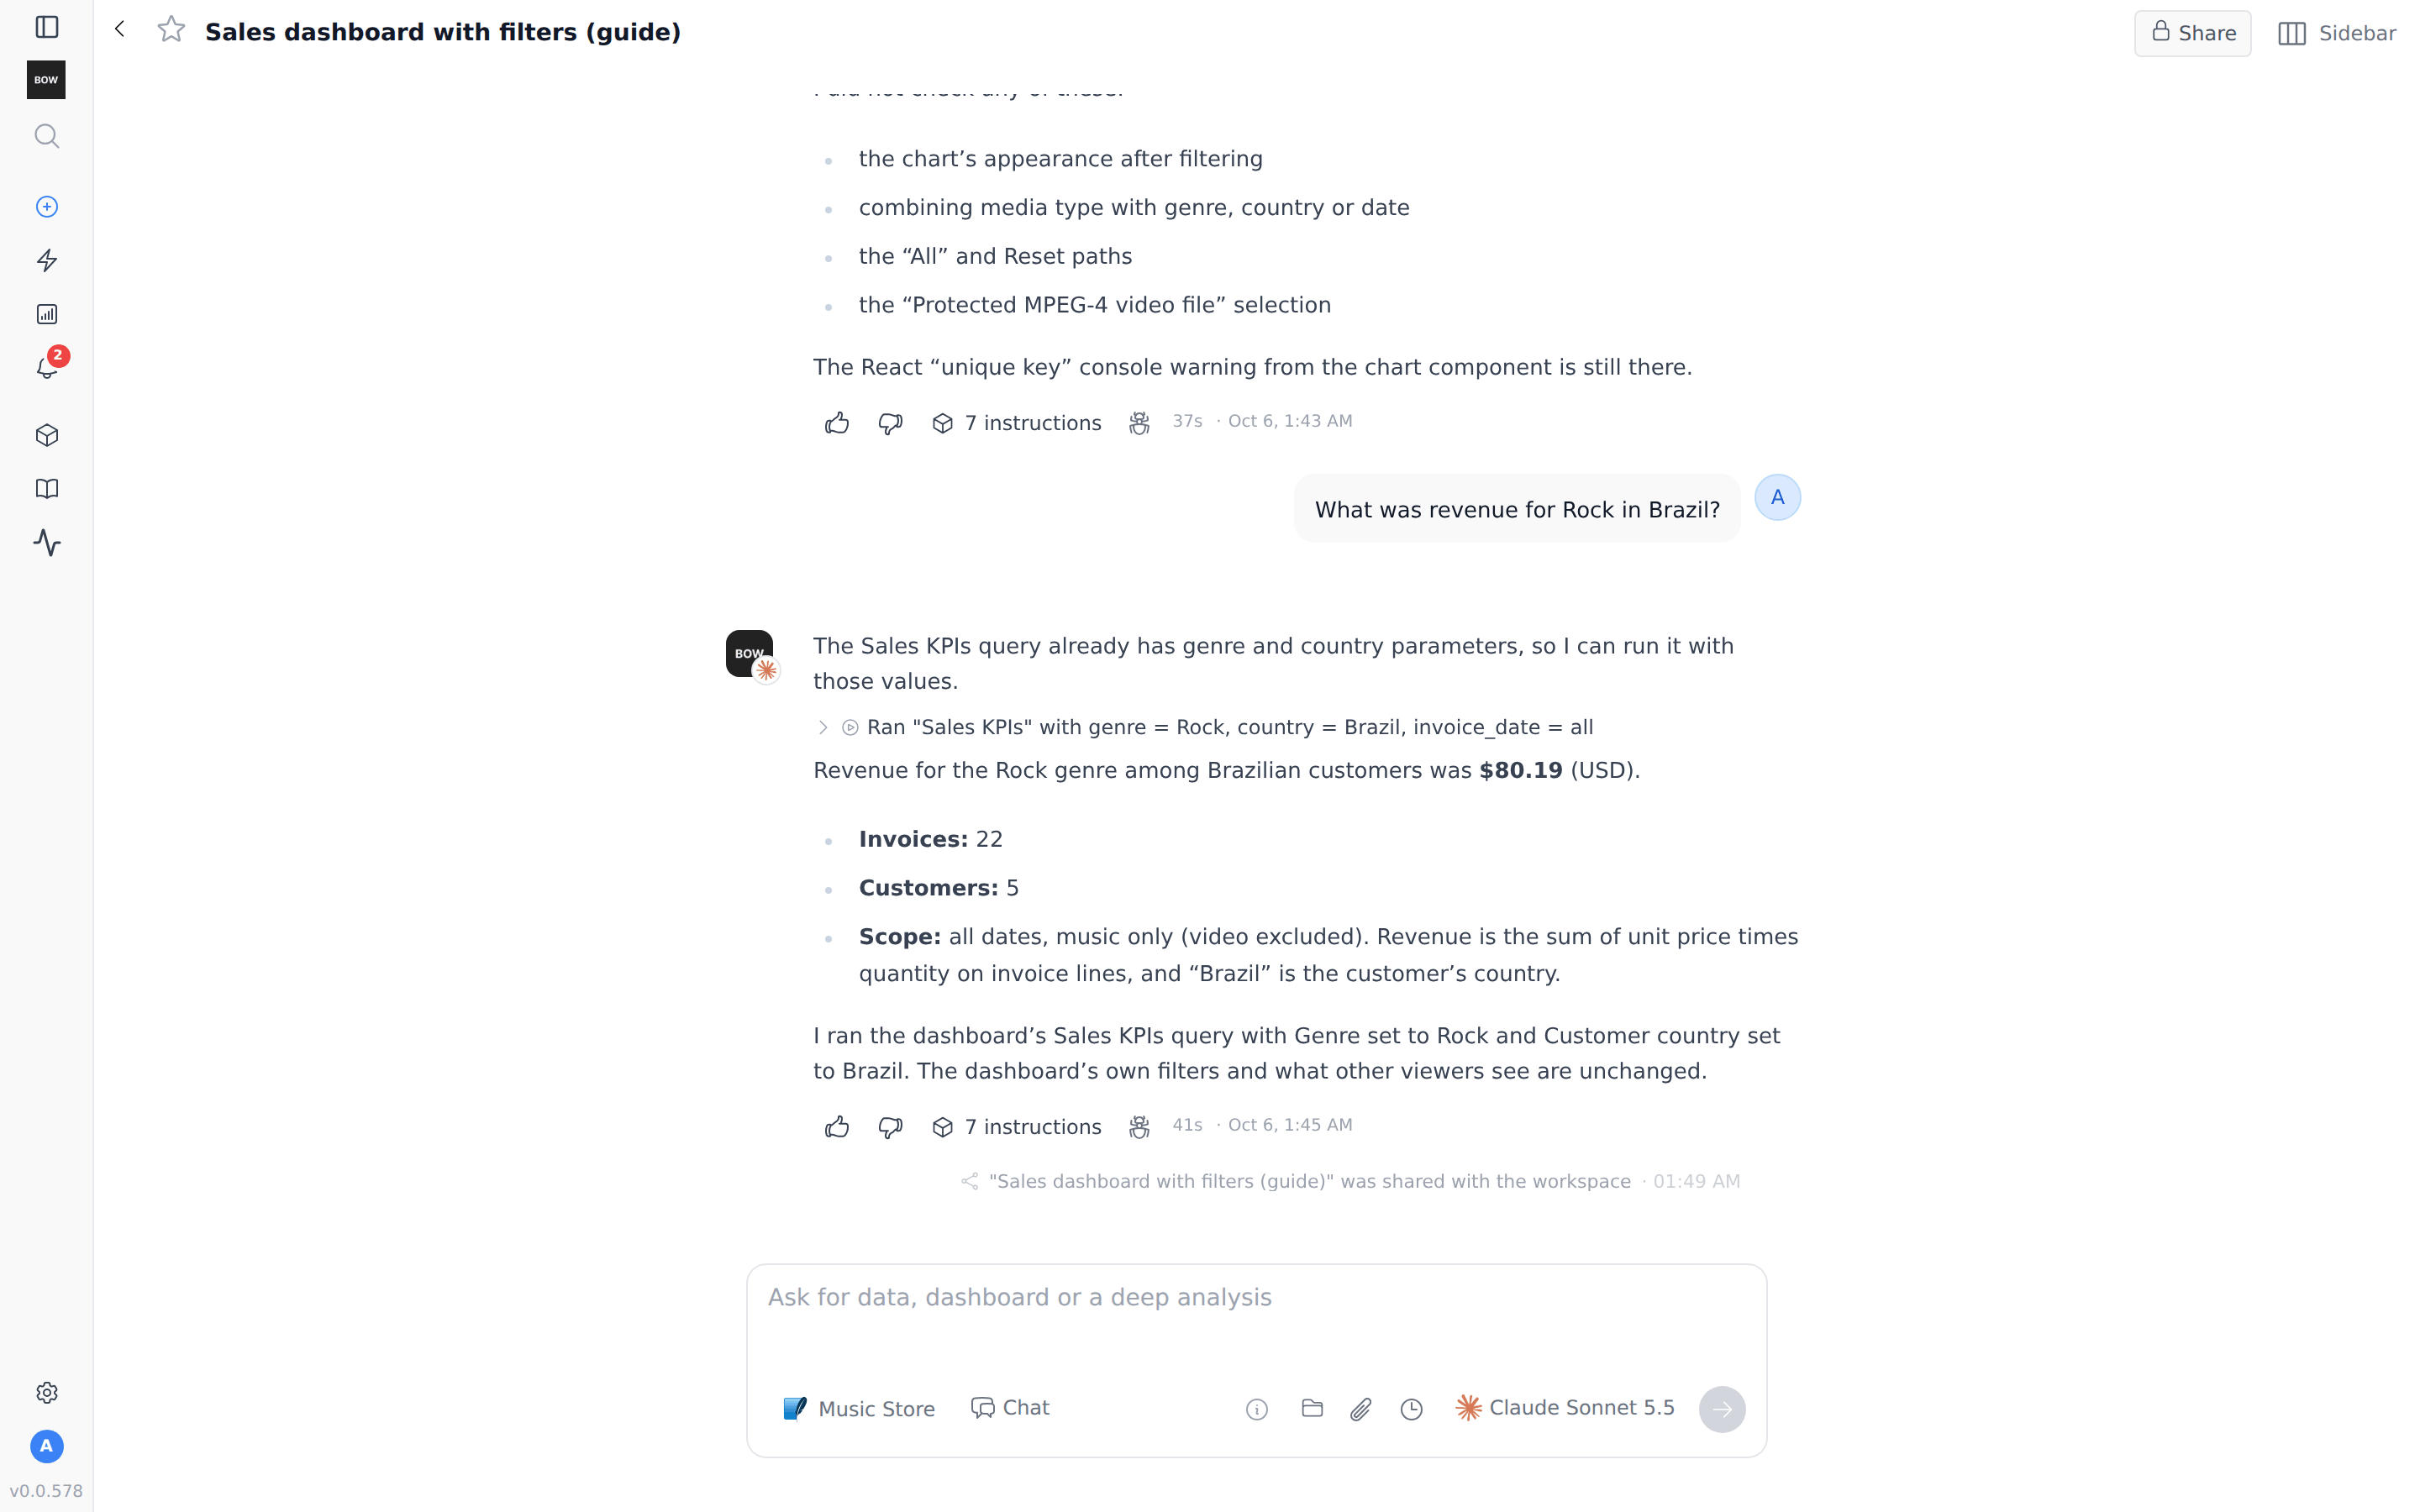
The agent runs the existing **Sales KPIs** query with new values and doesn't build a new one. The step reads **Ran "Sales KPIs" with genre = Rock, country = Brazil, invoice\_date = all**. The answer, \$80.19 across 22 invoices and 5 customers, matches the filtered dashboard. The dashboard's own filters don't change.
## Step 5: Ask questions with different values
A filter changes what one person sees on the dashboard. To get a quick answer for a different value, ask in chat:
> *What was revenue for Rock in Brazil?*
The agent runs the existing **Sales KPIs** query with new values and doesn't build a new one. The step reads **Ran "Sales KPIs" with genre = Rock, country = Brazil, invoice\_date = all**. The answer, \$80.19 across 22 invoices and 5 customers, matches the filtered dashboard. The dashboard's own filters don't change.
 ## Step 6: Try values and review the parameters
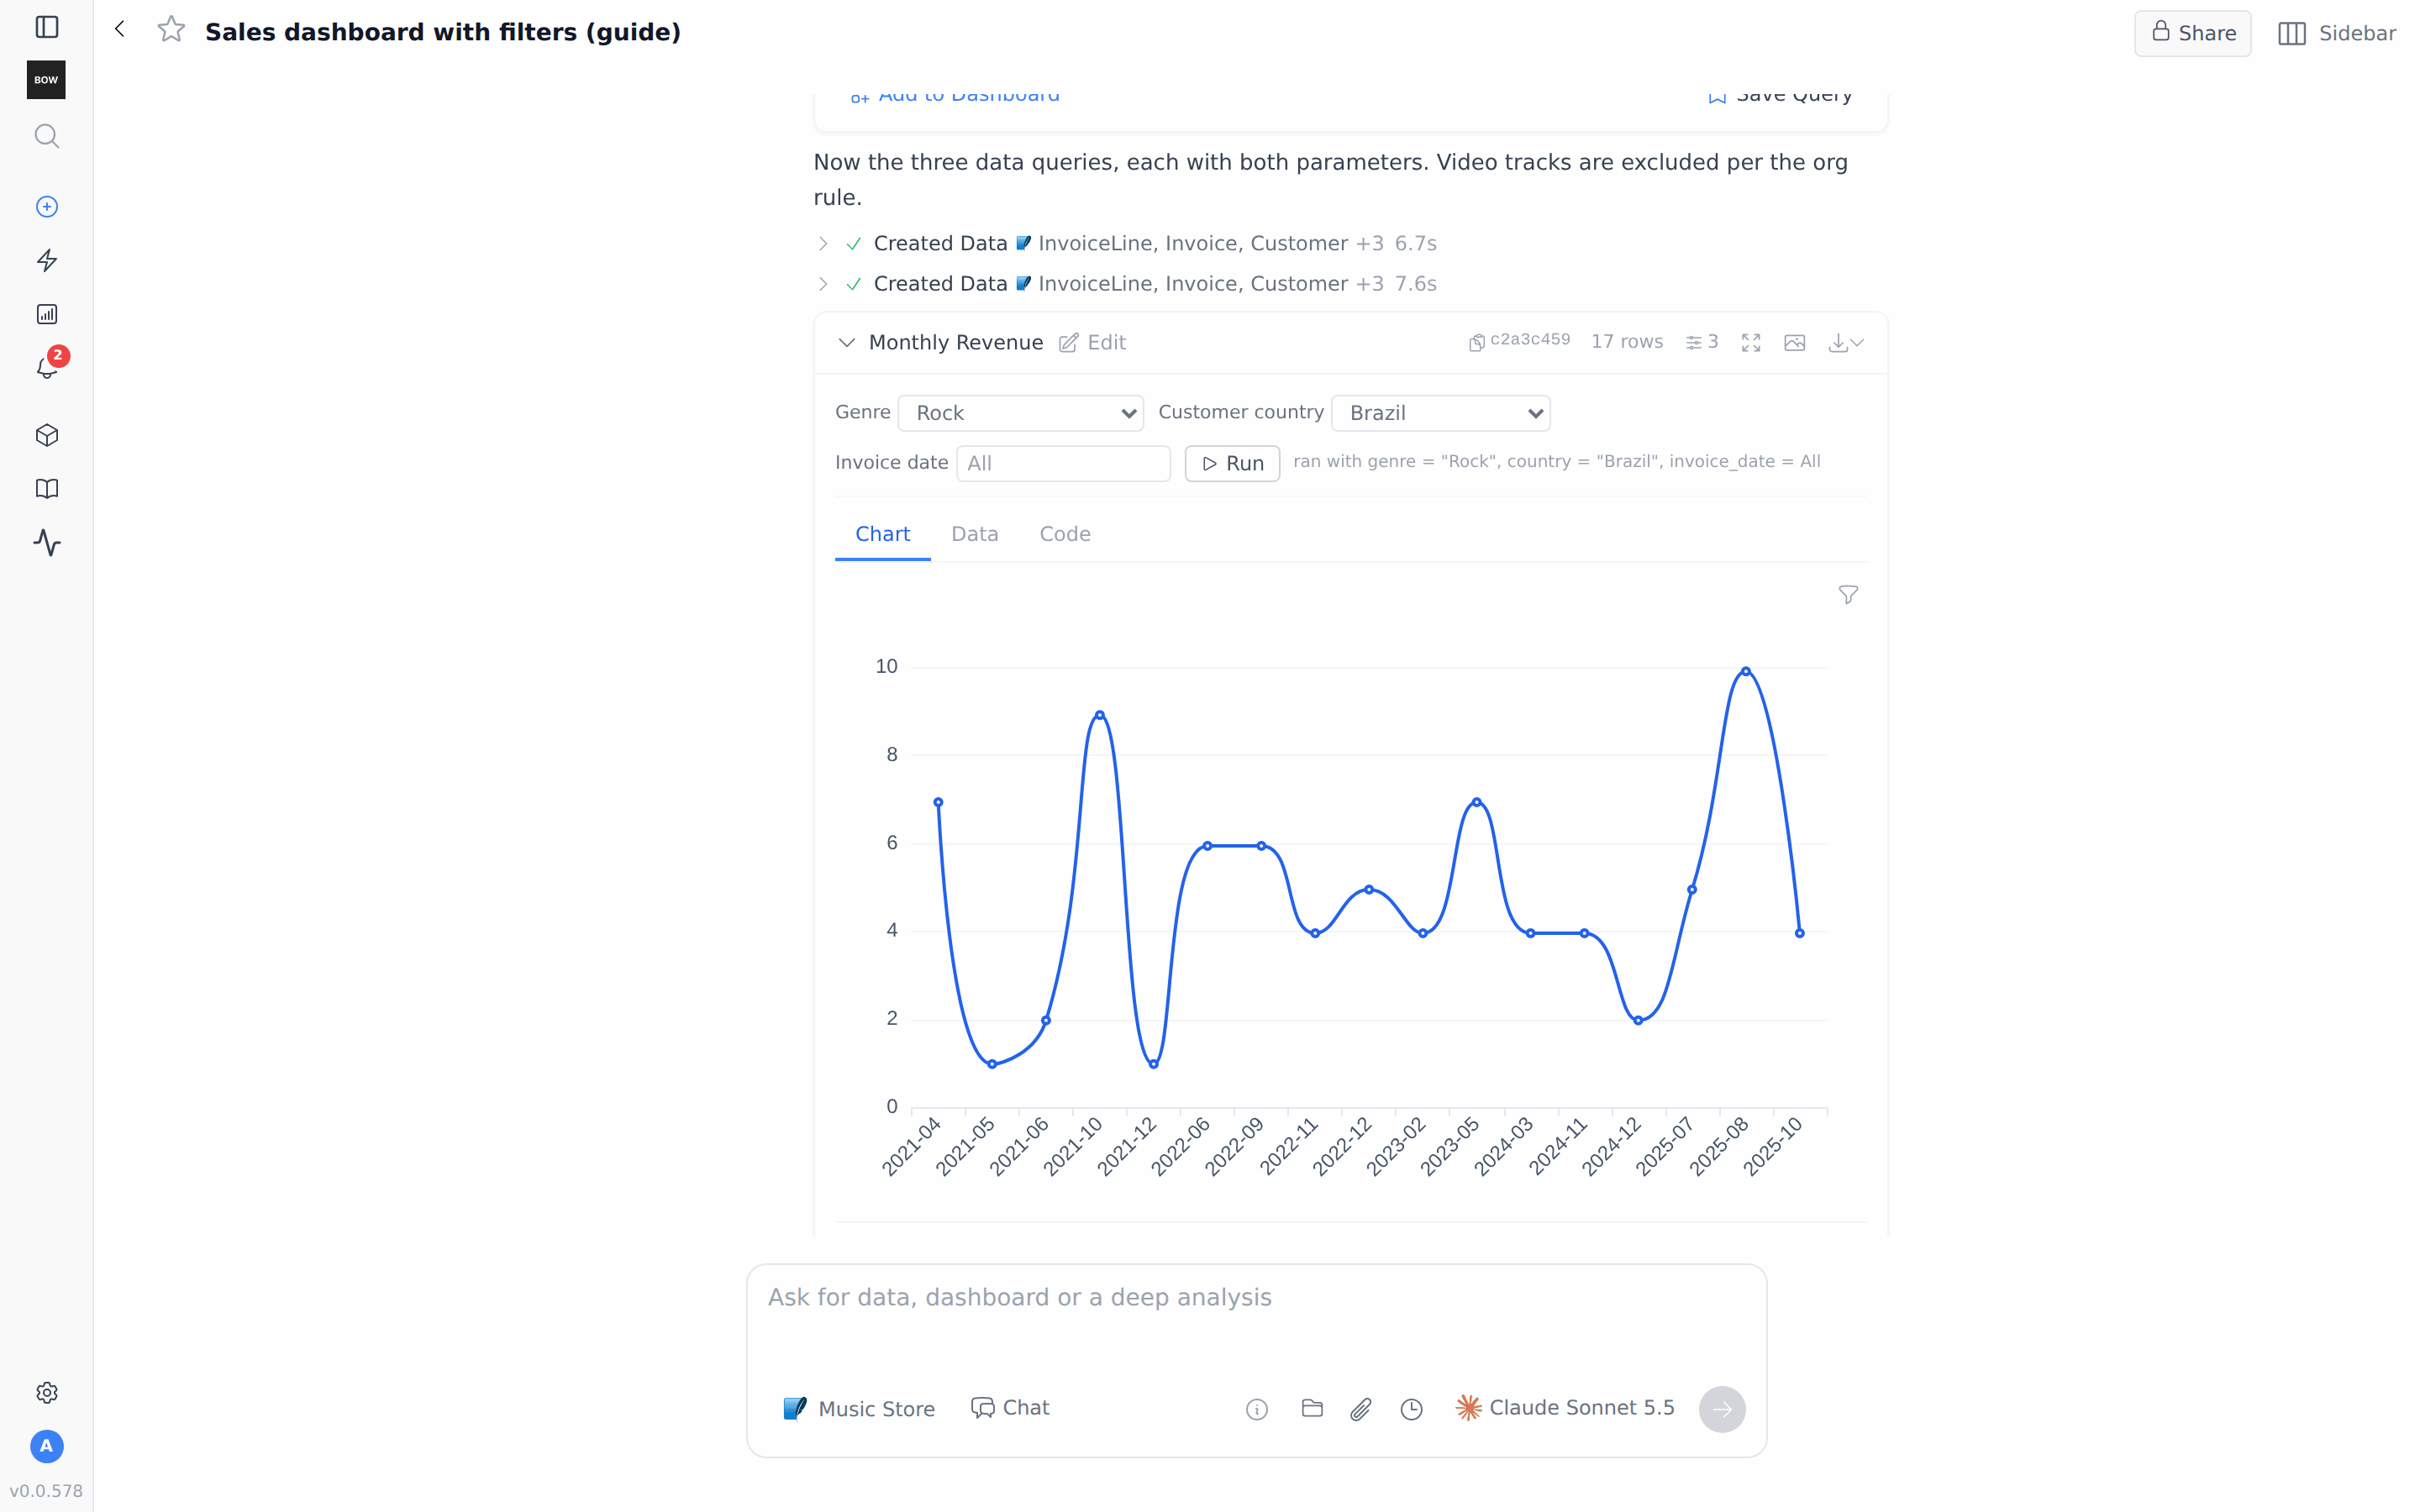
Each parameterized query card in the chat has its own controls. Set the values and click **Run**. The note next to **Run** shows the values used, for example **ran with genre = "Rock", country = "Brazil", invoice\_date = All**. The icon next to the row count shows how many parameters the query has.
## Step 6: Try values and review the parameters
Each parameterized query card in the chat has its own controls. Set the values and click **Run**. The note next to **Run** shows the values used, for example **ran with genre = "Rock", country = "Brazil", invoice\_date = All**. The icon next to the row count shows how many parameters the query has.
 To see how the parameters are declared, click **Edit** on the card and open **Params**. Each parameter has a name, a type, a source, a label and an optional default. A parameter with a source query also shows its **choices**, for example **from query → Genres → genre**. In the SQL, each value is a `:name` placeholder such as `:genre`. An empty value means **All**.
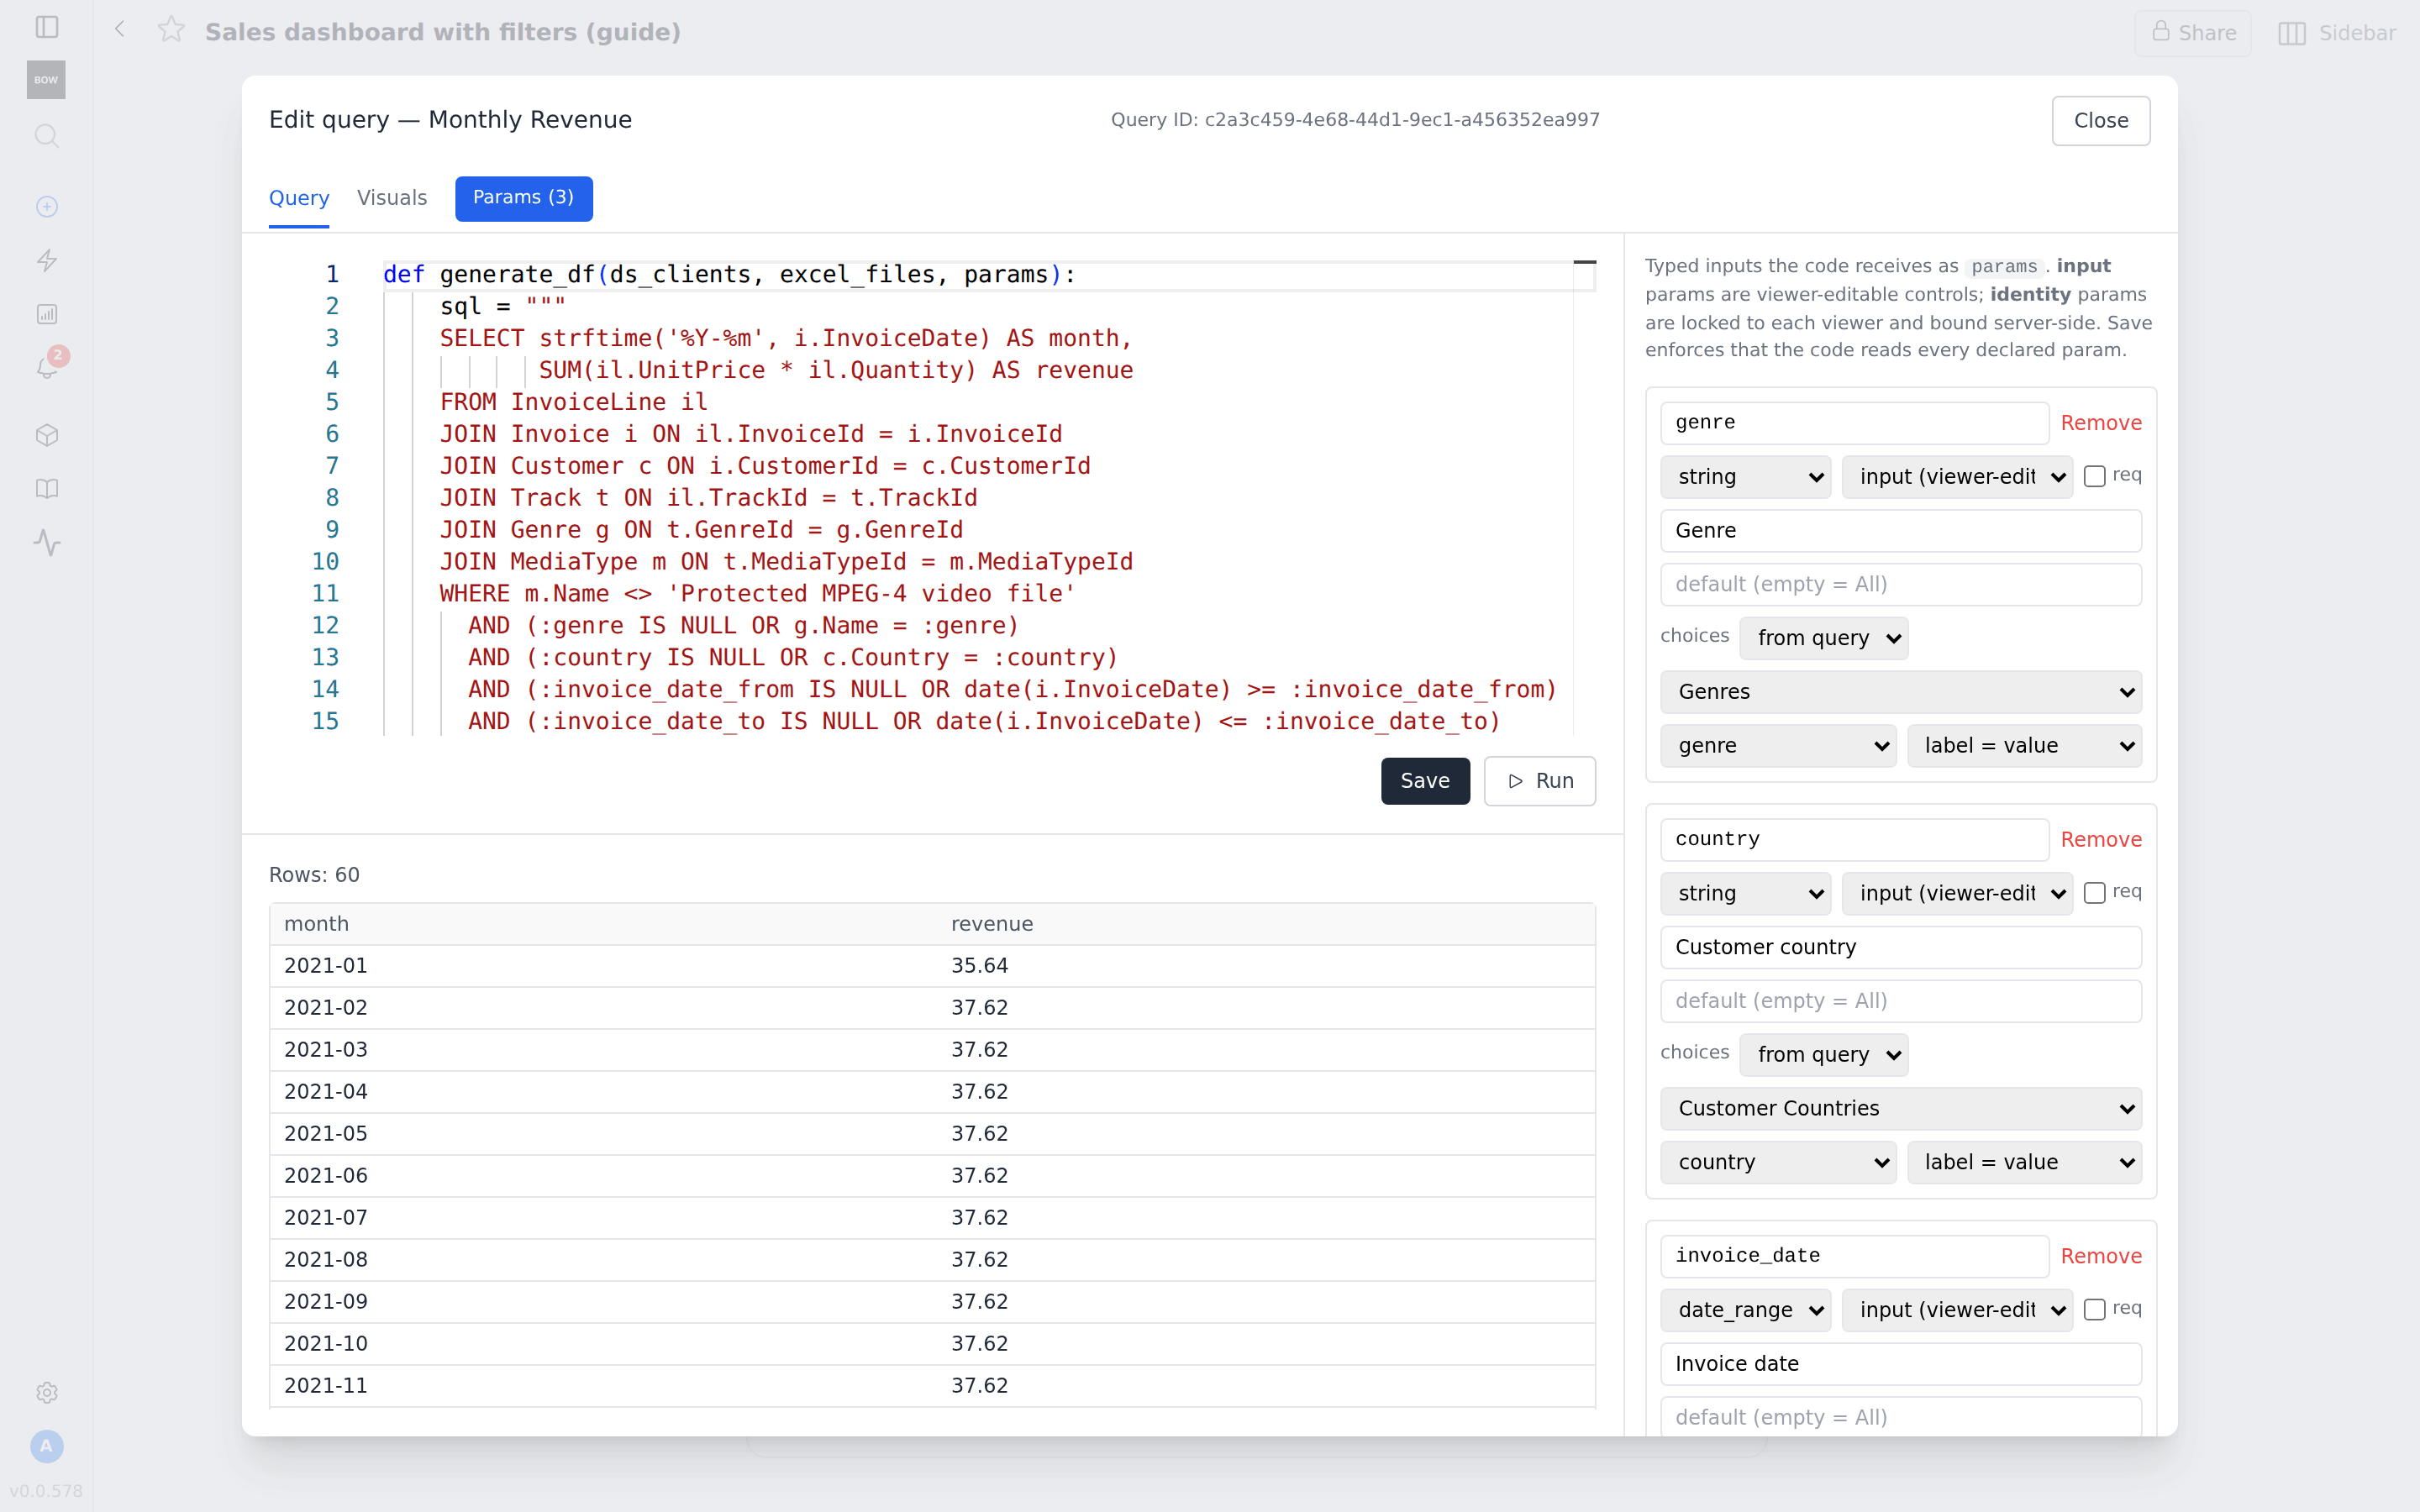 The types are `string`, `number`, `date`, `date_range`, `id` and `list`. The sources are **input (viewer-editable)**, **identity (locked to viewer)** and **input, defaults to viewer**. For identity parameters, see [Parameterized queries](/using-bow/parameterized-queries).
## Step 7: Save a parameterized query for reuse
Click **Save Query** under a card. The **Parameters** section lists the parameters that are saved with the query. Click **Save Entity**.
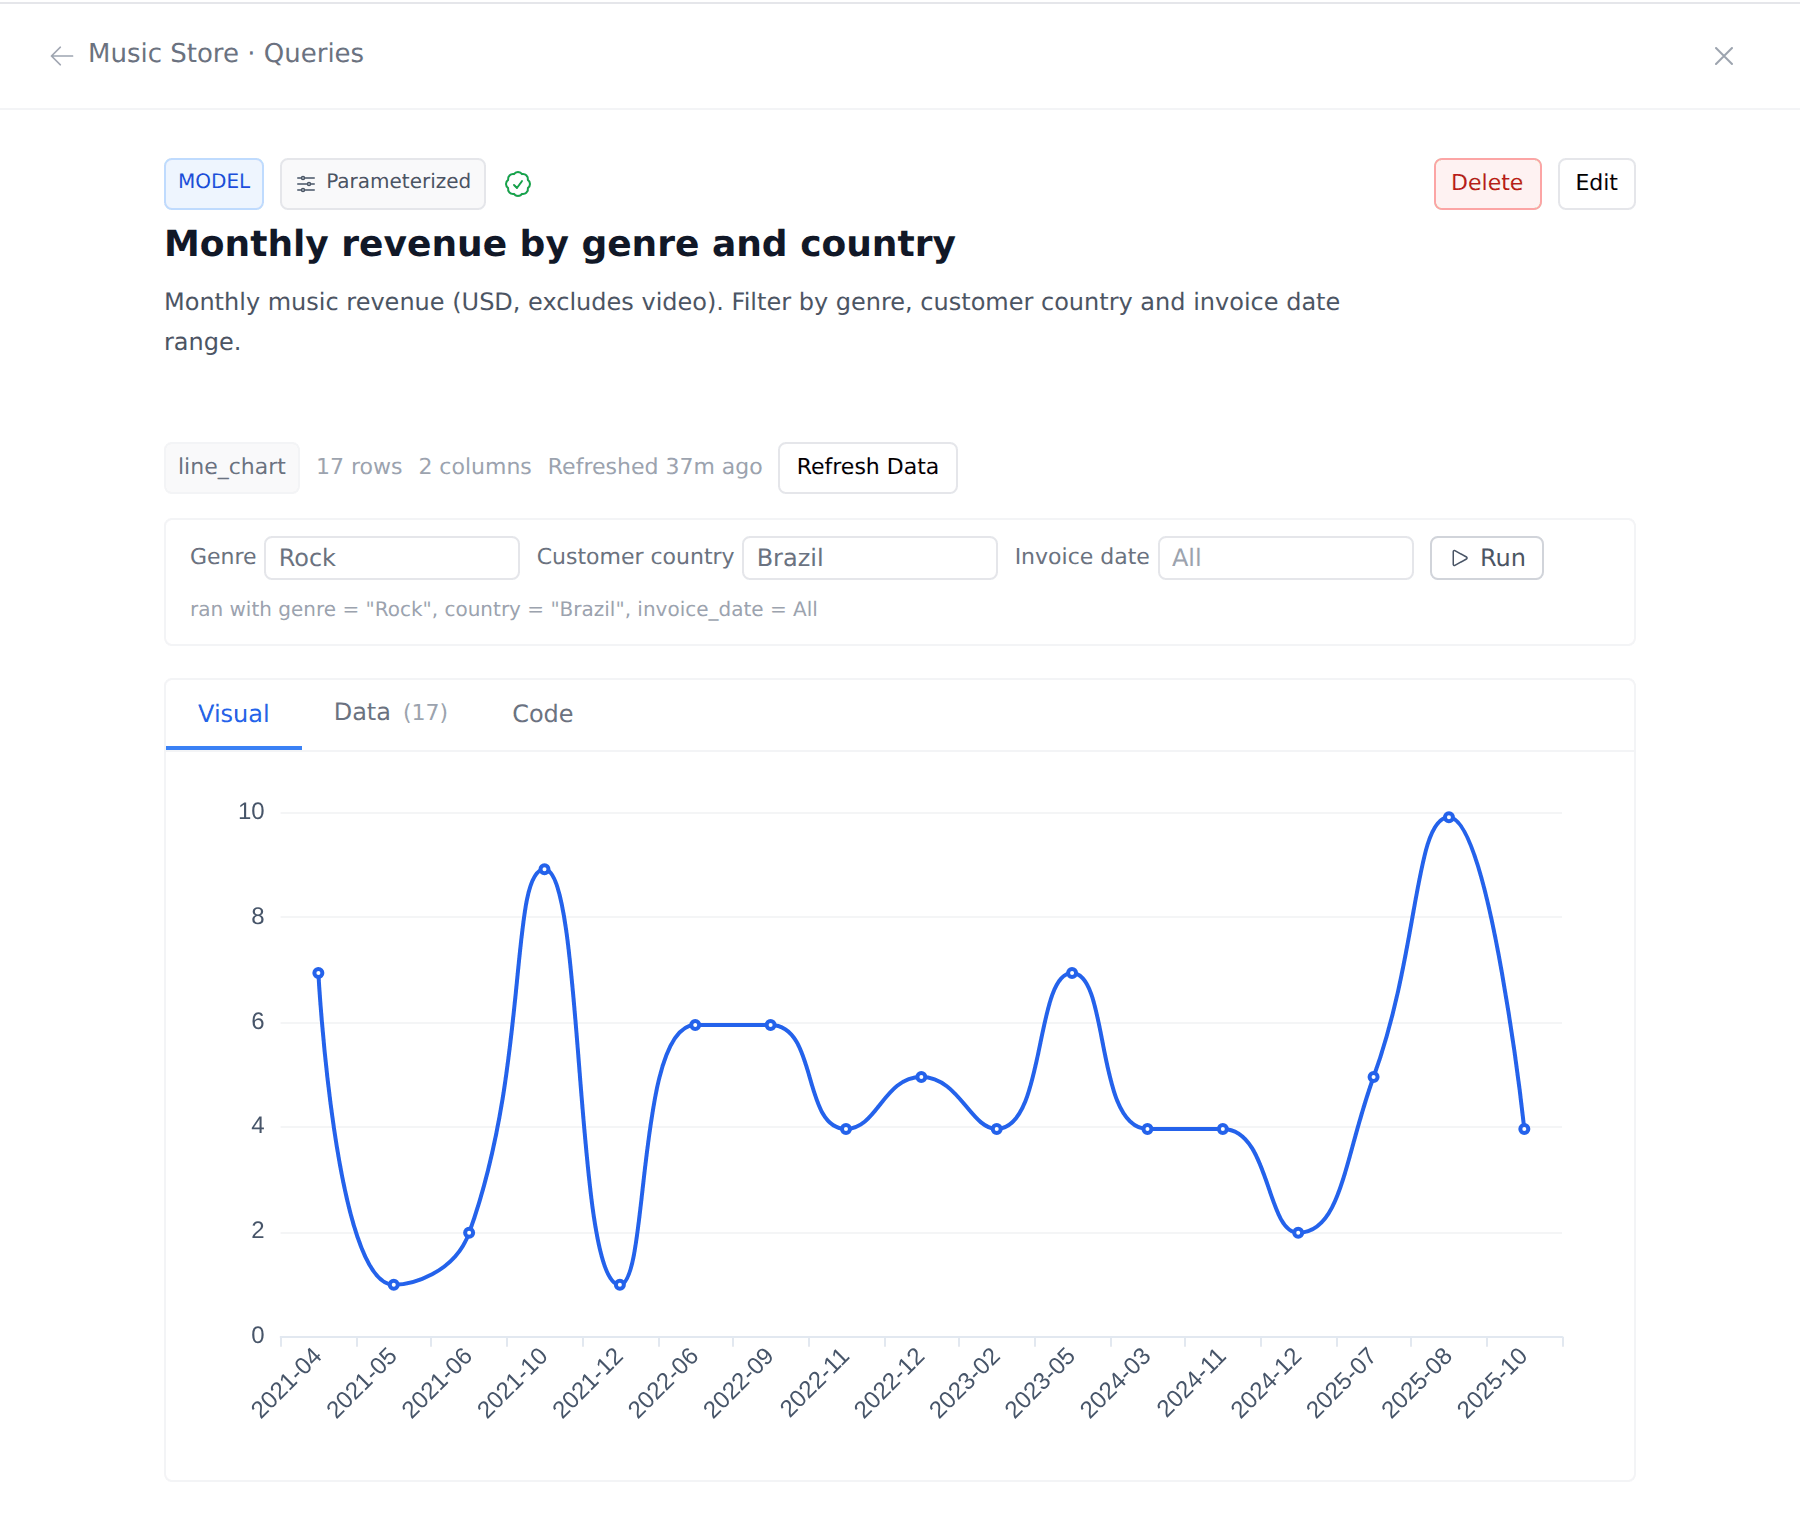
You can find the saved query in **Agents → Music Store → Queries**. It shows a **Parameterized** badge and a **Run** row where you enter values and run it again. To learn how the agent reuses saved queries, see [Saved queries](/guides/saved-queries).
The types are `string`, `number`, `date`, `date_range`, `id` and `list`. The sources are **input (viewer-editable)**, **identity (locked to viewer)** and **input, defaults to viewer**. For identity parameters, see [Parameterized queries](/using-bow/parameterized-queries).
## Step 7: Save a parameterized query for reuse
Click **Save Query** under a card. The **Parameters** section lists the parameters that are saved with the query. Click **Save Entity**.
You can find the saved query in **Agents → Music Store → Queries**. It shows a **Parameterized** badge and a **Run** row where you enter values and run it again. To learn how the agent reuses saved queries, see [Saved queries](/guides/saved-queries).
 ## More prompts to try
| Goal | Prompt |
| - | - |
| Filter on one chart | *Add a genre filter that applies only to the monthly trend.* |
| Answer without changing the dashboard | *Using the Sales KPIs query, what was revenue for Jazz in the USA in 2024?* |
## Tips
* **Name every filter in your first prompt.** The agent builds the list queries and parameters in one pass.
* **Say which charts a filter drives.** Use "drives every chart" or name one query, as in Steps 3 and 4.
* **Ask for numbers in chat.** The agent re-runs a parameterized query with your values instead of building a new one.
* **Check the Params panel.** It shows how each filter maps to the SQL.
## Troubleshooting
* **The agent rebuilds a query instead of updating it.** When the agent adds a filter, it sometimes creates a new version of a query and moves the dashboard to it. The result is the same. The old card stays in the chat history.
## Related
* [Parameterized queries](/using-bow/parameterized-queries)
* [Dashboard artifacts](/using-bow/dashboards)
* [Saved queries](/guides/saved-queries)
* [Reports](/using-bow/reports)
* [Train an agent](/agents/train-an-agent)
This documentation is built and hosted on [Mintlify](https://mintlify.com), a developer documentation platform.
## More prompts to try
| Goal | Prompt |
| - | - |
| Filter on one chart | *Add a genre filter that applies only to the monthly trend.* |
| Answer without changing the dashboard | *Using the Sales KPIs query, what was revenue for Jazz in the USA in 2024?* |
## Tips
* **Name every filter in your first prompt.** The agent builds the list queries and parameters in one pass.
* **Say which charts a filter drives.** Use "drives every chart" or name one query, as in Steps 3 and 4.
* **Ask for numbers in chat.** The agent re-runs a parameterized query with your values instead of building a new one.
* **Check the Params panel.** It shows how each filter maps to the SQL.
## Troubleshooting
* **The agent rebuilds a query instead of updating it.** When the agent adds a filter, it sometimes creates a new version of a query and moves the dashboard to it. The result is the same. The old card stays in the chat history.
## Related
* [Parameterized queries](/using-bow/parameterized-queries)
* [Dashboard artifacts](/using-bow/dashboards)
* [Saved queries](/guides/saved-queries)
* [Reports](/using-bow/reports)
* [Train an agent](/agents/train-an-agent)
This documentation is built and hosted on [Mintlify](https://mintlify.com), a developer documentation platform.